Download

1 / 22
220 likes | 235 Vues
This video provides an introduction to human population concepts, explores the impact of population growth on the environment, food supply, and health, and discusses the role of women in population control. It also highlights the importance of understanding population density and distribution.

E N D
Population Intro to Human Population Concepts
World Population, Population Explosion and Carrying Capacity • Begin at 1:00 to 6:10 • https://www.youtube.com/watch?v=4BbkQiQyaYc • Remember your Ecological Footprint numbers from Unit 1?
Population growth places stress on environmenthttp://www.epa.gov/climatechange/impacts-adaptation/international.html and http://antwerp.wikispaces.com/Global+Overpopulation • Farms and erodes soils • Fishes and depletes oceans • Mines and consumes minerals/fuels • Builds and cuts/destroys forests • Water for human use – agriculture, industry and home use • All of this made more problematic by 4-fold pop. increases in 20th century • And for context…only 30% of earth is land. Only fraction (1/3) of that is habitable/arable
Let’s think about this… • During the last approximately 120 years……. • The world’s population has grown 4-fold • The world’s use of fresh water supplies has grown 8-fold • Explain and Discuss
How 7 Billion Occurs • http://www.npr.org/2011/10/31/141816460/visualizing-how-a-population-grows-to-7-billion
FOOD SUPPLY HEalth • Green Revolution helped stem hunger from pop. growth in 1960s • High meat consumption puts pressure on the environment • Further increased meat consumption lead to global food crisis (Where and why is the occurring?) • Rapid population growth can cause increase in disease • Epidemics/pandemics happen or possible • Infant/child mortality is high in developing areas
STUDY OF POPULATION IS REALLY….. • ALL ABOUT WOMEN!! • Status of Women • Population control/reduction responsibilities have fallen largely on women • WHY? – Because low status = fewer rights • Female infanticide/abandonment • Education of women • Bottom Line – there is an inverse relationship between education level of women and population growth • Hans Rosling on Population – 10:00 min video – Let’s watch first 4 minutes • http://www.ted.com/talks/lang/en/hans_rosling_on_global_population_growth.html
In most parts of the world, why are women having fewer children? • Later marriage • Delaying childbirth (these two are different) • Higher cost of raising children • Urbanization • Status of women • Higher education levels • Higher economic status • Germany Statistic – In 2008, 39% of German women had reached the age of 40 without having had a child • Gender and population – Hans Rosling and the Magic Washing Machine – 9 min. • www.ted.com/talks/lang/en/hans_rosling_on_global_population_growth.html
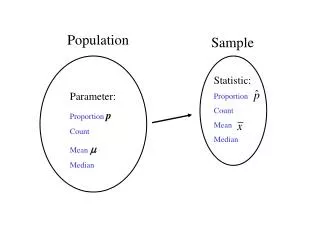
Density – • measures number of people per unit area (per mile/km)
Arithmetic, Physiologic, and Agricultural Population Density Arithmetic Population Density Physiologic Population Density • population as an avg. per unit area • Dividing population by the AREAL unit (#sq mi/km) • Agricultural Density • Number of people supported by a unit area of arable land • For example – US has 404 people per square mile, or arable land • number of people per unit area of ARABLE land • Which is more accurate? • Which gives us more details?
How about Egypt as an example? • A.P.D. – 85 / mile • P.P.D. – 6,808 / mile (in 2013) • 98% of Egypt’s population live on just 3% of the land • Egypt is said to be the most densely populated country in the world in terms of “useable land”
MEGALOPOLISorCONURBATION Tokaido in Japan
Megacities - Top Ten Cities – 1950 http://geography.about.com/library/weekly/aa011201g.htm Jot down these cities because it’s not in your text
Top Twenty Cities (write first 10) – 2010 – now compare to 1950.THINK BIG IDEA – WHAT HAS CHANGED??? 1. Tokyo-Yokohama, Japan - 33,200,0002. New York, United States - 17,800,0003. Sao Paulo, Brazil - 17,700,0004. Seoul-Incheon, South Korea - 17,500,0005. Mexico City, Mexico - 17,400,0006. Osaka-Kobe-Kyoto, Japan - 16,425,0007. Manila, Philippines - 14,750,0008. Mumbai, India (formerly Bombay) - 14,350,0009. Jakarta, Indonesia - 14,250,00010. Lagos, Nigeria - 13,400,00011. Kolkata, India - 12,700,00012. Delhi, India - 12,300,00013. Cairo, Egypt - 12,200,00014. Los Angeles, United States - 11,789,00015. Buenos Aires, Argentina - 11,200,00016. Rio de Janeiro, Brazil - 10,800,00017. Moscow, Russia - 10,500,00018. Shanghai, China - 10,000,00019. Karachi, Pakistan - 9,800,00020. Paris, France - 9,645,000 Population is not distributed evenly, however
Distribution – • describes population locations on the Earth’s surface (where people live)
Think about the spatial components of this – 5% of the world’s population is in BLUE. 5% of the world’s population is in the REDarea.ttp://metrocosm.com/the-global-extremes-of-population-density/
Major Population Concentrations • MAPS density and distribution – Again, make sure to study these maps and take a “mental snap shot” of these maps and be able to answer questions about them • Let’s play “Where’s Waldo” – Look at Australia, Saudi Arabia, Java, China, Canada - others • East Asia • South Asia • Europe • North America
http://envirosci.net/111/population/population_projection.jpghttp://envirosci.net/111/population/population_projection.jpg