Download
1 / 18
180 likes | 202 Vues
This study investigates the impact of various operating strategies on the average railcar transit time between Yard 1 and Yard 2. The research explores schedule adherence, hold for tonnage, and hold for tonnage with time limit strategies. The findings highlight the effects of railcar arrival distribution, train arrival interval, and departure schedule flexibility on transit times. The study aims to provide insights for optimizing freight railway operations.

E N D
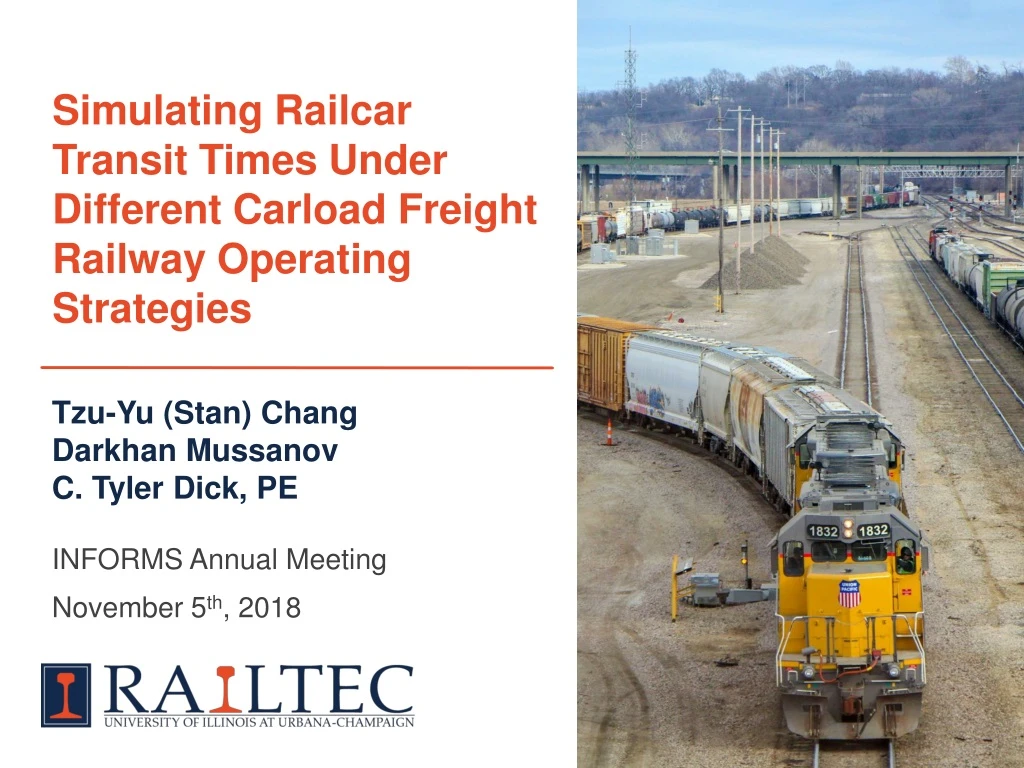
Simulating Railcar Transit Times Under Different Carload Freight Railway Operating Strategies Tzu-Yu (Stan) Chang Darkhan Mussanov C. Tyler Dick, PE INFORMS Annual Meeting November 5th, 2018
Introduction • Objective: Understand how different operating strategies affect the average railcar transit time from Yard 1 to Yard 2 • Literature review • Dong Y. (1997) • Simulated how different operating strategies affect the probability of missed train connections at yards and the subsequent impact • Dick CT, Mussanov D. (2016) • Mainline train delay versus train departure schedule flexibility • What’s new? • Schedule flexibility on the inbound train arrival time • Consider outbound train delay and schedule flexibility to calculate mainline travel time between yards • Different train departing frequency per day (2 trains vs 1 train) • Future single-person crews → short frequent trains
Introduction • Railcar transit time includes dwell time at Yard 1 and Yard 2 and mainline travel time • Investigate three operating strategies: • Schedule Adherence (SA) • Always depart at planned time • Hold for Tonnage (HT) • Hold train until N railcars accumulate • Hold for Tonnage with Time Limit (HTT) • Hold train until N railcars accumulate or for T hours maximum Outbound trains from Yard 1 Outbound trains from Yard 2 Y2 Y1 Inbound trains to Yard 1
SIGMA Model – Hold for Tonnage • Outputs: • Average transit time • Average additional delay time
Experiment Design • Threshold for Hold for Tonnage is equal to the expected number of cars on the outbound train to Yard 2 • Cutoff time and PMAKE function • Time limit for Hold for Tonnage with Time Limit • Schedule flexibility 00:00 04:00 15 20 08:00 Inbound trains to Yard 1 Expected number of railcars bound for Yard 2 25 12:00 Yard 1 16:00 40 Cut-off time Outbound train from Yard 1 to Yard 2 24:00
Result: Different Operating Strategies Hold for Tonnage Schedule Adherence Hold for Tonnage with Time Limit • Schedule Adherence has the shortest average railcar transit time • Dwell time at Yard 1 in Hold for Tonnage is longer than Schedule Adherence
Experimental Factors • Railcar arrival distribution • Train arrival interval • 12-hour departure and 24-hour departure https://www.ttnews.com/articles/union-pacific-starts-work-550-million-rail-yard-texas
Factor: Railcar Arrival Distribution • Expected number of railcars bound for Yard 2 is constant • Three railcar distributions: increasing (skewed to later trains), uniform, and decreasing (skewed to earlier trains) • Number of railcars for Yard 2 on an inbound train varies each day (i.e. 15 +/-5)”
Railcar Arrival Distribution with SA Increasing Uniform Decreasing • Two conflicting factors • Dwell time at Yard 1 • Expected number of railcars that miss connection at Yard 1
Railcar Arrival Distribution with HT Increasing Uniform Decreasing • If the threshold is not reached on Day 1, it is more likely to reach the threshold if the first train arrives on Day 2 carries more railcars bound for Yard 2
Railcar Arrival Distribution with HTT • Low schedule flexibility – similar to Schedule Adherence • High schedule flexibility – similar to Hold for Tonnage
Factor: Train Arrival Interval 00:00 4-hour 7-hour 1-hour 04:00 19:00 08:00 00:00 00:00 12:00 02:00 16:00 09:00 24:00 13:00 14:00 15:00 16:00 16:00 Cutoff Time 19:00 24:00 24:00
Train Arrival Interval with SA 7-hour 4-hour 1-hour • The two conflicting factors • Dwell time at Yard 1 • Expected number of railcars that miss connection at Yard 1
Train Arrival Interval with HT 4-hour 7-hour 1-hour • Dwell time at Yard 1 • 1-hour case is more sensitive to schedule flexibility
12-hour Departure vs 24-hour Departure • Schedule Adherence has a shorter average railcar transit time than Hold for Tonnage • Time saving per railcar is 2 to 5 hours for Schedule Adherence
Conclusion • As schedule flexibility increases, the average railcar transit time increases • Schedule Adherence has the shortest average railcar transit time • The case of bunched train arrivals close to the cutoff time allows a shorter average railcar transit time, but it is more sensitive to schedule flexibility of inbound trains • Departing two trains per day reduces the average railcar transit time compared to departing one train per day • One train/day with low schedule flexibility is almost equivalent to flexible at two trains per day
Future Work • Extract the dwell time at Yard 1 and Yard 2 and mainline transit time to understand which part is responsible for most of the delay • For Hold for Tonnage, conduct sensitivity tests on different thresholds • For Hold for Tonnage with Time Limit, conduct sensitivity tests on different time limits • Understand the relationship between bunched train arrivals and outbound train departure time • Extract average number of railcars on the outbound train from Yard 1 and understand its relationship with the average railcar transit time • Conduct sensitivity test on the distance between two yards
Thank you for your attention! Stan Chang Graduate Research Assistant Rail Transportation and Engineering Center (RailTEC) University of Illinois at Urbana-Champaign tzuyuyc2@illinois.edu This project is supported by the National University Rail Center (NURail), a US DOT-OST Tier 1 University Transportation Center, and the Association of American Railroads, with additional support from the Sargent & Lundy Fellowship