Download
1 / 19
190 likes | 359 Vues
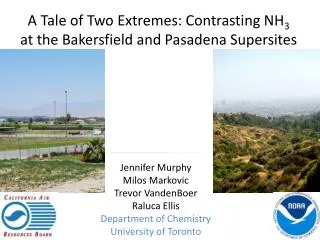
A Tale of Two Extremes: Contrasting NH 3 at the Bakersfield and Pasadena Supersites. Jennifer Murphy Milos Markovic Trevor VandenBoer Raluca Ellis Department of Chemistry University of Toronto. Ammonia and Particle Formation. Highly coupled and non-linear. H 2 SO 4. HNO 3.

E N D
ATale of Two Extremes: Contrasting NH3 at the Bakersfield and Pasadena Supersites Jennifer Murphy MilosMarkovic Trevor VandenBoer Raluca Ellis Department of Chemistry University of Toronto
Ammonia and Particle Formation Highly coupled and non-linear H2SO4 HNO3 NH4NO3 (NH4)2SO4 SO2 NOx NH3
Historical CARB data seasonality in NH4NO3 seasonality in (NH4)2SO4
NH3 in the San Joaquin Valley Fresno Visalia NH3 (ppb) TM5 model prediction Bakersfield IASI retrieval of atmospheric ammonia Mar – Oct average at 700 m during morning orbit (09:30 local) Clarisse et al., JGR, 2010
Mobile Emissions of NH3 Mobile emissions of NH3 comparable to NOx in new, aggressively driven, vehicles Bishop et al., ES&T, 2010
AIM-IC in Bakersfield A – PM2.5impactor B – membrane denuder C – particle collection chamber D – ion chromatographs Hourly gas and PM2.5 measurements of SO42-, NO3-, Cl-, Br-, NO2-, organic acids NH4+, K+, Na+, Mg2+, Ca2+, amines
QC-TILDAS in Pasadena Fast (1Hz) measurements of gas phase NH3 with minimal sampling artefacts Ellis et al., AtmosMeas Tech, 2010
Ammonia Time Series Bakersfield Pasadena hourly averages
Diurnal Profiles of NHx Partitioning Ammonia is controlled by emissions and dilution Ammonia is controlled by partitioning and transport AMS data from Jimenez group, CU
Temperature and NH3 at Bakersfield Daily Maximum Ammonia (ppb) Overnight Temperature (K)
Comparison with Model CMAQ data courtesy of Kirk Baker, US EPA
Model usually has a low bias for NH3 Model usually has a high bias for HNO3 Model overestimates NH4NO3
Historical Record at Bakersfield Partitioning can account for winter NH4+, but not NO3-
Summary • NHx is ~4 times larger at Bakersfield than at Pasadena • different processes control NH3 at the two ground sites • CMAQ does not represent Bakersfield NH3 well • (emissions or partitioning) • Additional Questions • aerosol pH • influence of/on organic acids • relative contributions of NH3 emissions sources
FREE AMMONIA, FA = TA – 2 * TS = [NH4+] + [NH3(g)] – 2 * [SO42-] Ohio Valley Particle Fraction predict partitioning using ISORROPIA Markovicet al., Atmos. Chem. Phys., 2011
High NH3, low TS and TN Nitrate partitioning driven mainly by meteorology 100 80 60 40 20 0 Particle Fraction Conditions: RH = 40 %, T = 275 – 315 K, TN = 20 nmol m-3 , TS = 21 nmol m-3 , TA = 0 - 2750 nmol m-3 FA values during the campaign = ( -42 nmol m-3 to 2750 nmol m-3 )
Pasadena data on chemical map generated assuming TN = 100 nmol m-3 TN actually ranges from 10 – 700 and correlates with FA Particle Fraction