Download
1 / 1
20 likes | 216 Vues
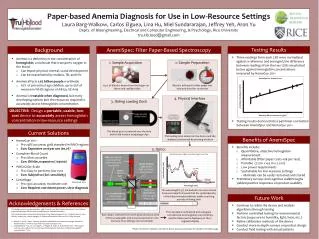
Paper-based Anemia Diagnosis for Use in Low-Resource Settings Laura Barg-Walkow , Carlos Elguea , Lina Hu , Miel Sundararajan , Jeffrey Yeh , Aron Yu Depts. of Bioengineering, Electrical and Computer Engineering, & Psychology, Rice University tru.Hb.lood@gmail.com . Background.

E N D
Paper-based Anemia Diagnosis for Use in Low-Resource Settings Laura Barg-Walkow, Carlos Elguea, LinaHu, MielSundararajan, Jeffrey Yeh, Aron Yu Depts. of Bioengineering, Electrical and Computer Engineering, & Psychology, Rice University tru.Hb.lood@gmail.com Background Testing Results AnemiSpec: Filter Paper-Based Spectroscopy • Three readings from each LED were normalized against a reference and averaged; the difference between readings from the two LEDs are plotted below against hemoglobin concentrations measured by HemoCue 201+ • Testing results demonstrate a 94% linear correlation between AnemiSpecand HemoCue201+ • Anemia is a deficiency in the concentration of hemoglobin, a molecule that transports oxygen in the blood • Can impair physical, mental, social development • Can be exacerbated by malaria, TB, and HIV • Anemia affects 1.62 billion people worldwide • 67% of pre-school age children, up to 50% of women in WHO regions of Africa, SE Asia • Anemia is treatable when diagnosed, but many developing nations lack the resources required to accurately assess hemoglobin concentration 1. Sample Acquisition 2. Sample Preparation 10 µL of blood is drawn from the finger via lancet and capillary tube Blood is delivered to filter paper test strip and dried for 15 minutes 4. Physical Interface OBJECTIVE: Design a portable, usable, low-cost device to accurately assess hemoglobin concentration in low-resource settings 3. Sliding Loading Dock The final [Hb] in g/dL is output on a 7-segment display LEDs emit specific wavelengths at high frequencies sequentially • HemoCue 201+ • Pro: 98% accurate, gold standard in WHO regions • Con: Expensive cost per use ($0.76) • Complete Blood Count • Pro: Most accurate • Con: Offsite, expensive (>$3000) • WHO Color Scale • Pro: Easy to perform, low cost • Con: Subjective (60% sensitivity) • Centrifuge • Pro: 90% accurate, moderate cost • Con: Requires consistent power, slow diagnosis Current Solutions Stage clips to hold sample in place Beam splitting cube divides light onto both photodiodes The loading dock slides into the device and the analysis is performed by pressing a button Magnetic catch for precise positioning Lenses collimate light The blood spot is centered over the hole and is held in place using stage clips Benefits of AnemiSpec Future Work • Benefits include: • Quantitative, objective hemoglobin measurement • Affordable (filter paper costs <2¢ per test) • Portable (7.5 in x 4.5 in x 2.5 in) • Low power requirements • Sustainable for low-resource settings • - Materials can be easily restocked and stored • Preliminary surveys and cognitive walkthroughs yielded positive responses on product usability • Continue to refine the device and analysis algorithms through testing • Perform controlled testing for environmental factors (exposure to humidity, light, heat, etc.) • Refine calibration methods of the device • Conduct more in-depth surveys on product design • Conduct field testing with actual patients 5. Optics Reference photodiode receives signal from LEDs 577 nm HemoCue 201+ >680 nm Raw data is collected from both photodiodes at each of the wavelengths and stored temporarily in the memory of an MSP430 microcontroller The wavelengths 577 nm and 680 nm were chosen because research showed that the optical density of the blood remains relatively stable over long periods of drying time Sample photodiode collects light transmitted through the blood sample Acknowledgements & References This design project was supported by a gift from Mr. and Mrs. Hunter Armistead to the Oshman Engineering Design Kitchen and through Beyond Traditional Borders. We would also like to thank the following for their help and support: Dr. Z. Maria Oden, Dr. Gary Woods, Jasper Yan, Garrett Spiegel, Dr. Rebecca Richards-Kortum, and Dr. Philip Kortum. Nestel, P. and H. Taylor. “Anemia detection methods in low-resource settings: manual for health workers.” PATH (1997): Web Accessed 7 October 2010. (Unpublished) Yan, J.S., C.A. Elguea, J. Wright, M. Oden, R. Richards-Kortum. “Filter paper as a low-cost medium for accurate spectrophotometric detection of blood hemoglobin concentration.” 2010. The raw data is normalized and averaged, correlated to a hemoglobin concentration, and the final result is displayed on the 7-segment display *Note: the device remains turned on but in a low-power state for duration of field usage