Basic Trigonometry Review: Understanding SOH-CAH-TOA Concepts
Explore the fundamental principles of trigonometry, focusing on the relationships between hypotenuse, opposite, and adjacent sides. Learn how to plot sine, cosine, and tangent graphs, understanding their positive and negative values in different quadrants. Discover the CAST acronym for trigonometric functions. Delve into symmetry in trigonometric graphs and understand key concepts through examples.

Basic Trigonometry Review: Understanding SOH-CAH-TOA Concepts
E N D
Presentation Transcript
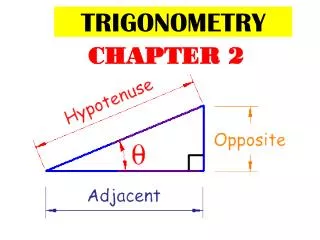
hypotenuse opposite xo adjacent yo hypotenuse adjacent opposite A review of basic trigonometry SOH CAH TOA ‘Opposite’ and ‘adjacent’ are defined by the angle that is being considered.
Consider a circle of radius 1. If the red line is rotated from its starting point then a series of triangles will be formed – the radius always being the hypotenuse. Given that sinx is defined as the ratio of the opposite side to that of the hypotenuse, the graph of y = sin x can be plotted. y 1 Q2 Q1 y = sin xo 180o 90o 270o 360o xo Q3 Q4 -1 Q2 Q3 Q1 Q4
Q1 Q2 Q3 Q4 Notice that in Q1 all the curves are positive – that is, they have a y-value greater than 0. y = sin xo In the other three quadrants, only one curve is positive – the other two are negative: y = sin xo is positive in Q2. y = tan xo is positive in Q3. y = cos xo is positive in Q4. y = cos xo This is summarised by the CAST acronym: y = tan xo
The solid lines indicate symmetry on the graphs. On the sine graph the y-value at x = 30o will be identical to that at x = 150o. i.e. sin 30o = sin 150o y = sin xo y = cos xo The dashed lines indicate another type of symmetry on the graphs. On the cosine graph the y-value at x = 60o will be the negative of that at x = 120o. i.e. cos 60o = – cos 120o y = tan xo