
Genetic Linkage Map of T. aestivum Revealing QTLs for Salt Stress Adaptation in ITMI Population
This figure illustrates the genetic linkage map of Triticum aestivum, highlighting Quantitative Trait Loci (QTLs) identified in the ITMI mapping population specifically under salt stress conditions. The map features symbols representing genetic sources: diamonds indicate Opata 85, with solid diamonds marking major QTLs and empty ones denoting minor QTLs. Triangles represent W-7984, with solid triangles for major QTLs and empty triangles for minor QTLs. This visual representation aids in understanding the genetic basis of salt stress tolerance in wheat.

Genetic Linkage Map of T. aestivum Revealing QTLs for Salt Stress Adaptation in ITMI Population
E N D
Presentation Transcript
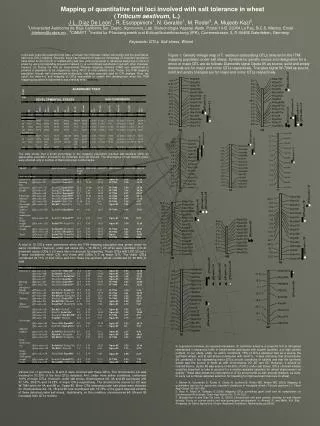
Figure 1. Genetic linkage map of T. aestivum associating QTLs detected in the ITMI mapping population under salt stress. Symbols for genetic source and designation for a minor or major QTL are as follows: Diamonds signal Opata 85 as source, solid and empty diamonds are for major and minor QTLs respectively. Triangles signal W-7984 as source, solid and empty triangles are for major and minor QTLs respectively.