Download

1 / 9
90 likes | 215 Vues
Learn how to create heatmaps in JavaScript to visualize 3D data on a 2D surface. Understand the colors representing temperature and explore resources for implementing heatmaps in web development.

E N D
Make a Heatmap with JS Bernard O’Leary
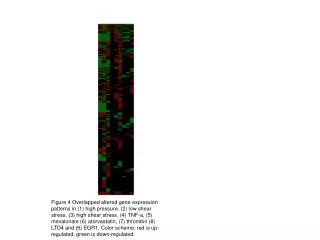
WTF is a Heatmap? • 3D data visualisation. • Dots on 2D surface. • 3rd dimension is the dot’s “temperature”. • Hot (high end) = red. • Cold (low end) = blue.
Resources (For “Actual” Maps) • BjoernHoehrmann: http://www.websitedev.de/temp/openlayers-heatmap-layer.html • Patrick Wied (Heatmap.js): http://www.patrick-wied.at/static/heatmapjs/ • Google Fusion Tables: https://developers.google.com/maps/documentation/javascript/examples/layer-fusiontables-heatmap • WebGL: http://badassjs.com/post/42283655307/using-webgl-for-high-performance-javascript-heatmaps, https://github.com/pyalot/webgl-heatmap
NZ Census Data: Case Study 1 • Fusion Tables: http://www.timemirror.com/mix/index.html
NZ Census Data: Case Study 2 • BjoernHoehrmann’s JS file: http://www.hotmash.info/
Thanks! bernard dot oleary at gmail dot com