Wireless Technology Pilot Project
Wireless Technology Pilot Project . Rita Ordóñez, Coordinator WSFMA Conference January 30, 2010. The Wireless Technology Pilot Project. 2009 grant program through the WSFMA that provided markets with wireless Point of Sale machines that take food stamp/EBT cards, credit and debit cards.

Wireless Technology Pilot Project
E N D
Presentation Transcript
Wireless Technology Pilot Project Rita Ordóñez, Coordinator WSFMA Conference January 30, 2010
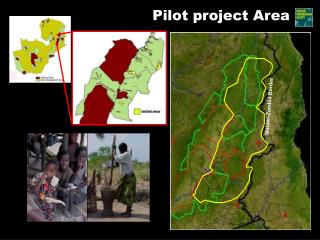
The Wireless Technology Pilot Project • 2009 grant program through the WSFMA that provided markets with wireless Point of Sale machines that take food stamp/EBT cards, credit and debit cards. • The program served 20 markets across the State of Washington.
The funding for the pilot program came from: • Local Farms Health Kids legislation signed into law March 2008 • Program created in DSHS to increase access to fresh fruits and vegetables and quality meat and dairy for all Washington residents and to increase the use of food stamp benefits at farmers markets.
The Wireless Technology Pilot Program offered markets: • Funding for: • A wireless Point of Sale machine • Wooden Tokens • Outreach materials • Training
How did program work? • Market booth sold tokens to customers • Transaction made on wireless machine • Credit/debit and food stamp tokens different • Customer spent tokens at vendors booths • Vendors turn in tokens to market for reimbursement • Market counts tokens and reimburse vendors • Market reconciles transactions made and fees charged from bank and processor statements
Fees Charged by ProcessorePaymentAmerica's eSNAP program • Markets paid $19 a month to have a wireless terminal. • Markets paid a $4.95 statement fee for each month the market was in operation. • Markets paid a $5.00 monthly debit access fee. • Markets must meet $25 transaction fee minimum during months of operation. • Markets also pay fees on each transaction.
Fees Charged by ePaymentAmerica's eSNAP program (TX Direct)- Continued
How were additional costs of program paid for? • Some markets charged vendors a percentage of CREDIT/DEBIT sales to pay for the service and for bookkeeping which was done by the market • Increased sales resulted in increased stall fees and these were used by some markets to partially cover costs. • Vendors were not charged a fee for EBT/food stamp transactions • Customers were not charged a fee
‘What did markets need assistance with? • Getting certified to take food stamps -Markets had to fill out a USDA Food and Nutrition Services Supplemental Nutrition Assistance Program (SNAP) application to get authorized to take SNAP benefits. -paper applications call (877) 823-4369 -online applications http://www.fns.usda.gov/fsp/retailers/application-process.htm
Assistance (continued) • Accounting procedures • Tokens, POS machine and security • Vendor reimbursement system • Forms for tracking tokens including unredeemed tokens • System to reconcile with processor statement
Assistance (continued) • Outreach to customers • Marketing materials • Ideas for outreaching to low income customers • Community organization partnerships • Signage inside market
What were results?Sales • Total sales for all 20 markets $302,417 • Average all sales $25 • Total SNAP sales $49,349 (16%) • Average sale $20 • Total Credit sales $157,448 (52%) • Average sale $30 • Total Debit sales $93,140 (31%) • Average sale $23 -$2480 sales breakdown from Kirkland missing-only data available was mid season report and season end totals -Data from Duvall only from mid season report
Transactions • Total transactions for all 20 markets 11,912 • Average # transactions 596 • Total SNAP transactions 2,514 • Average # transactions 126 • Total Credit transactions 5,269 • Average # transactions 264 • Total Debit transactions 4,129 • Average # transactions 207
Unredeemed Tokens in dollars • Total unredeemed tokens $24,365 • Total unredeemed SNAP tokens $2,988 • Total Credit/Debit unredeemed tokens $21,377 • $637 unredeemed tokens from Kirkland unknown breakdown
Challenges • Processor! • Markets need to make sure they do business with a reputable processor that has experience working with farmers markets • This arena is a vastly more complex environment than the one most farmers markets typically operate. • Wireless connection and technology (dropped transactions, etc) • Staffing booth and 2-5 hrs extra time spent bookkeeping each week • Outreaching to low income customers • Funding additional costs - monthly service and transaction fees
Successes • Increased involvement by the pilot farmers markets with other community partners • Increased sales for vendors • This was a broadly administered project which assisted markets to overcome a significant financial hurdle while allowing local independence in meeting community needs. • Markets further developed a viable micro-economy for farmers while also serving some of our communities most vulnerable citizens. • Markets served a broader range of customers. Dollars were kept in the local economy and low income families had increased access to healthy, fresh, locally grown food.
SNAP – Food Stamp Usage • In 2008, Basic Food sales at farmers markets totaled $34,026.49. In 2009, they were $142,764.95, an increase of 319.6 percent. • Basic Food purchases at certified farmers grew between 2008 and 2009 by 316.2 percent. There were 7,000 transactions during 2009 compared to 1,682 transactions in 2008. • Prior to the legislation, there were 28 USDA/FNS certified farmers markets in Washington. Of those, only 17 markets were actively accepting and redeeming Basic Food benefits. As a direct result of the legislation, 17 additional markets were certified by the USDA/FNS, a 60.7 percent increase. This represents the largest percentage increase of certified Washington farmers markets since the implementation of EBT in 1999. • During 2007, there were no farmers markets accepting Basic Food benefits in Eastern Washington. Now there are nine (9).
Final Thoughts • Currently, no new funding available to start up a new set of grantees. • Legislative Report by DSHS on WSFMA website. Link to report is on WSFMA home page under News. • The project demonstrated to the Legislators that the Wireless Technology pilot project was a success because it was a public investment that supported small farmers AND contributed to the rebuilding of our local food systems.