Download
1 / 1
10 likes | 142 Vues
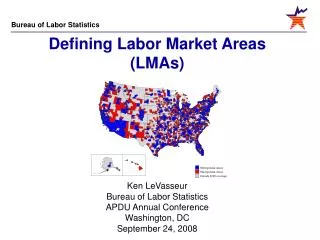
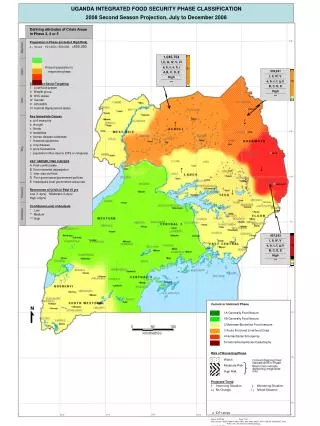
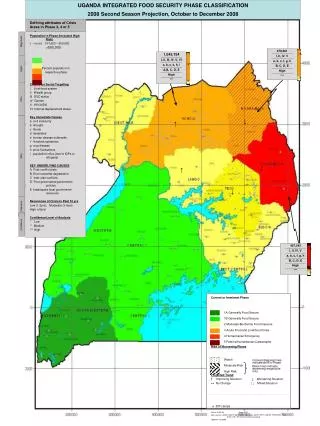
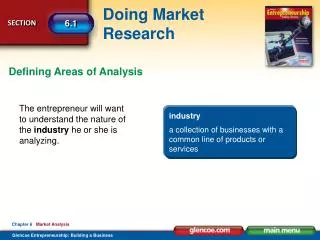
UGANDA INTEGRATED FOOD SECURITY PHASE CLASSIFICATION 2008 Second Season Projection, October to December 2008. Defining attributes of Crisis Areas in Phase 3, 4 or 5. Population in Phase (Include # High Risk) 0 – 100,000 101,000 – 500,000 >500,000 Percent population in respective phase

E N D
UGANDA INTEGRATED FOOD SECURITY PHASE CLASSIFICATION 2008 Second Season Projection, October to December 2008 Defining attributes of Crisis Areas in Phase 3, 4 or 5 Population in Phase (Include # High Risk) 0 – 100,000 101,000 – 500,000 >500,000 Percent population in respective phase Criteria for Social Targeting I Livelihood system II Wealth group III OVC status IV Gender V HIV/AIDS VI Internal displacement status Key Immediate Causes a civil insecurity b drought c floods d landslides e human disease outbreaks f livestock epidemics g crop disease h price fluctuations i population influx (due to IDPs or refugees) KEY UNDERLYING CAUSES A Post-conflict state B Environmental degradation C Inter-clan conflicts D Poor governance/government policies E Inadequate local government resources Recurrence of Crisis in Past 10 yrs Low (1-2yrs), Moderate (3-4yrs) High (>5yrs) Confidence Level of Analysis * Low ** Medium *** High Magnitude 378,261 ---------------------- I, II, IV. V ---------------------- a, b, c, f, g, h ---------------------- B, C, D, E ---------------------- High ---------------------- *** 1,045,754 ---------------------- I, II, III, IV, V, VI ---------------------- a, b, c, e, h, i ---------------------- A,B, C, D, E ---------------------- High ---------------------- *** 76 91 Depth 24 9 Who ↑ ↑ Why ↑ ↑ ↑ Frequency Confidence 407,543 ---------------------- I, II, IV, V ---------------------- a, b, c, f, g, h ---------------------- B, C, D, E ---------------------- High ---------------------- *** 76 10 14 Current or Imminent Phase Risk of Worsening Phase Projected Trend ↑ Improving Situation ↓ Worsening Situation ↔ No Change ↑↓ Mixed Situation ▲ IDP camps Datum: WGS 84 Maps: FAO Data sources: UBOS, MAAIF, MoH, DWD, Met. Dept, UNDP, WFP, UNICEF, FEWSNET, FAO, WHO, JRC, IPC Technical Working Group Updated: July 2008


![[4] [5] [3] [2] [4]](https://cdn1.slideserve.com/2491770/slide1-dt.jpg)