Download
1 / 2
30 likes | 192 Vues
Neighborhood Tree Canopy. LAND 640 Final Project. April 29, 2008, Mike Droske. Introduction. Results. Smallest subdivision: Plumtree Condos- 0.19 acres. % Canopy: 40.9%.

E N D
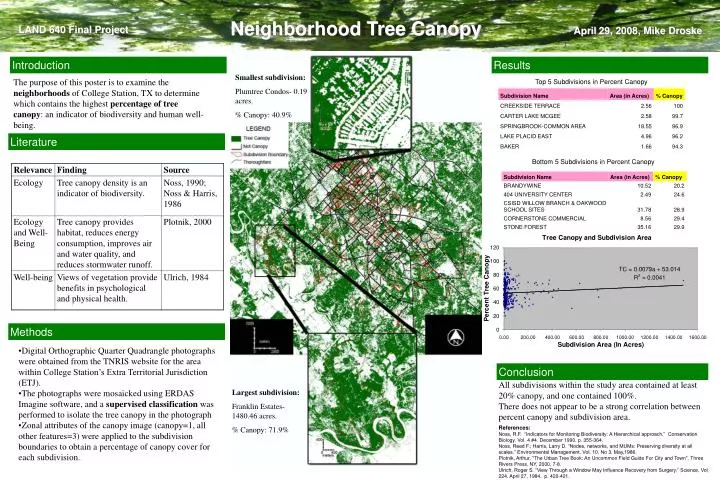
Neighborhood Tree Canopy LAND 640 Final Project April29, 2008, Mike Droske Introduction Results Smallest subdivision: Plumtree Condos- 0.19 acres. % Canopy: 40.9% The purpose of this poster is to examine the neighborhoods of College Station, TX to determine which contains the highest percentage of tree canopy: an indicator of biodiversity and human well-being. Top 5 Subdivisions in Percent Canopy Literature Bottom 5 Subdivisions in Percent Canopy Methods • Digital Orthographic Quarter Quadrangle photographs were obtained from the TNRIS website for the area within College Station’s Extra Territorial Jurisdiction (ETJ). • The photographs were mosaicked using ERDAS Imagine software, and a supervised classification was performed to isolate the tree canopy in the photograph • Zonal attributes of the canopy image (canopy=1, all other features=3) were applied to the subdivision boundaries to obtain a percentage of canopy cover for each subdivision. Conclusion All subdivisions within the study area contained at least 20% canopy, and one contained 100%. There does not appear to be a strong correlation between percent canopy and subdivision area. Largest subdivision: Franklin Estates- 1480.46 acres. % Canopy: 71.9% References: Noss, R.F. “Indicators for Monitoring Biodiversity: A Hierarchical approach.” Conservation Biology. Vol. 4 #4. December 1990. p. 355-364. Noss, Reed F.; Harris, Larry D. “Nodes, networks, and MUMs: Preserving diversity at all scales.” Environmental Management. Vol. 10, No 3. May,1986. Plotnik, Arthur, "The Urban Tree Book: An Uncommon Field Guide For City and Town", Three Rivers Press, NY, 2000, 7-8. Ulrich, Roger S. “View Through a Window May Influence Recovery from Surgery.” Science, Vol. 224. April 27, 1984. p. 420-421.
Neighborhood Tree Canopy LAND 640 Final Project April29, 2008, Mike Droske Correlation With Other Factors As an exploration of the relationship between tree canopy coverage and well-being, I plotted residential tenure against percent tree canopy. However, there was no apparent relationship between the two factors.