
Marketing Engineering Model
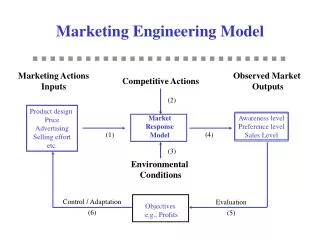
Product design Price Advertising Selling effort etc. Awareness level Preference level Sales Level. Marketing Engineering Model. Marketing Actions Inputs. Observed Market Outputs. Competitive Actions. (2). Market Response Model. (1). (4). (3). Environmental Conditions.

Marketing Engineering Model
E N D
Presentation Transcript
Product design Price Advertising Selling effort etc. Awareness level Preference level Sales Level Marketing Engineering Model Marketing Actions Inputs Observed Market Outputs Competitive Actions (2) Market Response Model (1) (4) (3) Environmental Conditions Control / Adaptation (6) Evaluation (5) Objectives e.g., Profits
Steps in Creating a Marketing Response Model • Develop a relationship between sales and marketing variables • Sales = f(marketing variables) • Calibrate the model • Statistically or judgmentally • Create a profit model • Profits = unit volume x contribution margin – fixed costs • Optimize • What if or optimum
Linear Response Model: • Y = a + b1X1 + b2 X2 • Examples: • Medical advertising • Conjoint analysis • Bookbinders Book Club • Price, cart, and coupon exercise • Easy to estimate, robust, good within certain ranges • Optimum is either zero or infinity • Judgmental – sales at current level of effort and change in sales for a one unit change in effort.
Weight Loss Response and Profit Model • Response Model • Profit Model
Nonlinear Response Models: ADBUDG b – minimum Y a – maximum Y c – shape, 0 < c < 1 concave; c > 1 s-shaped d – works with c to determine specific shape
R(X ) R(X ) 1.5 R(X ) 1.0 R(X ) 0 Response function: Expected Sales Relative to Base 0 1.5 ´ Base Base Effort Relative to Base
ADBUDG Model • Examples: • Response Modeler: units of marketing effort and sales • Conglomerate: four cities responding to sales promotion • Spreadsheet Exercise: (Blue Mountain Coffee) sales response to advertising • Syntex: 7 products or 9 specialties responding to number of sales calls • John French: 4 accounts responding to call frequency
Using Solver to Estimate Response Functions • Locate parameters and choose starting values • Create columns for independent and dependent variables. Calculate mean of dependent variable. • Create column of predicted dependent variables based on parameters and independent variables. • Create column of squared errors between actual and predicted dependent variable. Sum this column. • Use solver to search over parameters to minimize sum squared errors.
Judgmental Calibration of ADBUDG • Data: R(Xminimum), R(Xsaturation), R(X1.0), and R(X1.5) • Parameters: • a = R(Xsaturation) • b = R(Xminimum) • d = (a-R(X1.0))/(R(X1.0)-b) • c = ln((d*(R(X1.5)-b)/(a-R(X1.5))/ln(1.5)
Judgmental Calibration of ADBUDG • Data: R(Xminimum), R(Xsaturation), R(X0.5), R(X1.0), and R(X1.5) • Parameters: • a = R(Xsaturation), b = R(Xminimum) • d = (a-R(X1.0))/(R(X1.0)-b) • Solve for c using least squares over R(X0.5) and R(X1.5)
Profit Models • Unit Sales = f(marketing variables) Response Function • Profits = Unit Sales(margin) – fixed costs • Example: Example on page 38
Different Shapes of Multiplicative Model : Y= aXb b>1 0<b<1 Y=a b<0 X=1
Multiplicative Models Cont’d • Estimate judgmentally • Sales at current level of marketing variable(s) • Percent change in sales for a percent change in marketing variable i = exponent bi • Yc=a Xcb • Solve for a
Multiplicative Models Cont’d • Examples: • Allegro: Sales = a price-b . Advc • Nonlinear Advertising Sales Exercise • Forte Hotel Yield Management: Sales = a price-b • Constant elasticity – exponents are elasticities • Models both increasing (adv) and decreasing (price) functions as well as both increasing (positive feedback) and decreasing (adv and price) returns
Other Linearizable Models • Exponential Model: Y = aebx; x > 0 • Ln Y = Ln a + bX • Models increasing (b>1) or decreasing (b<1) returns . • Semi-Log Model: Y = a + b Ln X • Reciprocal Model: Y = a + b/X = a + b (1/X) • Models saturation • Quadratic Model: Y = a + bX + c X2 • Supersaturation • Ideal points in MDS • Bass Model
Choose model based on: • Theory • Fit • Pattern of error terms • Signs and T-statistics of coefficients
Response Function Max Sales Response Response Function Current Sales Min Current Effort Effort Level
Elasticity - Percent change in the dependent variable divided by the percent change in the independent variable • = (Y/Y)/(X/X) = (Y/X) (X/Y) = (dy/dx)(X/Y) • If Y = bX then = 1 For example, if we double X (from x to 2x), Y also doubles (from bx to 2bx), so the percent change in X is always the same as the percent change in Y. • If Y = a + bX, then Y/X = b(x)/ x = b and X/Y = X / (a + bX) and = (Y/X) (X/Y) = bX/(a+bX) <1 if a>0
Elasticities with a Multiplicative Model Y = aXb • = (dy/dx)(X/Y) • dy/dx = a bXb-1 • = (a bXb-1) (X/aXb) = (a bXb-1 X)/aXb = b
Elasticity – A way to compare various marketing instruments • = (Y/Y)/(X/X) = (Y/X) (X/Y) = (dy/dx)(X/Y) • (Adv Existing Product) = .05 - .15 • (Adv New Product) = .20 - .40 • Advertising Long Term = 2X Short Term • (Price) = -2.5 • (Coupons) = .07 Source:Bucklin and Gupta, 1999
Elasticity in Product Classes where P&G Competes • (Adv) = .039 • (Price) = -.541 • (Deals) = .092 • (Coupons) = .125 Source: Ailawadi, Lehmann, and Neslin 2001
Effect of Increasing Advertising • Assume 100 units sold at $1.00/unit, 50% contribution margin, advertising elasticity of .22, and 10% A/S ratio • No change in advertising: • Profit = (100 * $.50) - $10 = $40 • A 50% increase in advertising – sales increase by 11% • New Profit = (111 * $.50) - $15 = $40.50
Aggregate Response Models:Dynamics • Dynamic response model • Yt = a0 + a1 Xt +l Yt–1 Easy to estimate. Difficult to interpret correctly carry-overeffect currenteffect