
Uploaded by
dahlia
0 SLIDES
351 VUES
90LIKES
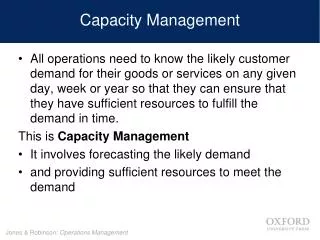
VMware Capacity Management
DESCRIPTION
VMware Capacity Management. Presented by Metron using Athene. Agenda. Key Metrics for VI3 Increasing Efficiency Intelligent Reporting Intelligent Trending / Forecasting Intelligent Modeling ITIL Capacity Management. Reasons for Capacity Management.
Download

1 / 0
Télécharger la présentation 
VMware Capacity Management
An Image/Link below is provided (as is) to download presentation
Download Policy: Content on the Website is provided to you AS IS for your information and personal use and may not be sold / licensed / shared on other websites without getting consent from its author.
Content is provided to you AS IS for your information and personal use only.
Download presentation by click this link.
While downloading, if for some reason you are not able to download a presentation, the publisher may have deleted the file from their server.
During download, if you can't get a presentation, the file might be deleted by the publisher.
E N D
Presentation Transcript
-
VMware Capacity Management
Presented by Metron using Athene - Agenda Key Metrics for VI3 Increasing Efficiency Intelligent Reporting Intelligent Trending / Forecasting Intelligent Modeling ITIL Capacity Management
- Reasons for Capacity Management Ensure the Enterprise receives ROI for their IT resources Ensure capacity levels support established service level targets – Quality of Service Ensure capacity is forecasted based on business events
-
Key Metrics for VI3
Monitoring and Alerting - VI3 METRICS Out of all the metrics available What should I look at, how should I use What should I monitor? For what reason? Problems / Transient? Trends? What should I alert on? >80%?
- VMware metrics Host / guest metric families CPU %busy, %ready etc Memory used/free, reclaimed, swapped etc I/O rate and response times by disk NIC packets in/out, data rate in/out Datastore size/free/used (host only) Logical disk size/free/used (guest only) Resource pools Definitions, limits, shares Clusters CPU and Memory available for VMs
- Resource Pool - Key Metrics Resource Pools CPU Available for VM Reservation CPU Usage Memory Available for VM reservation Memory Usage Is the Resource Pool expandable? Proven Practice - Resource Pool Capacity Management with Metron Athene
- Cluster - Key Metrics Clusters Effective CPU Available for VMs Effective Memory Available for VMs Total Number of Hosts Total VM Migrations Proven Practice: Capacity Management Reporting for VMware Clusters with Metron Athene Proven Practice - Creating a VMware Capacity Management Dashboard with Metron Athene
- Host - Key Metrics Host Physical CPU utilisation Memory In Use Memory Allocated to VMs Memory Swapped In NIC utilisation Datastore Utilisation
- VM - Key Metrics VM Ready Time Ballooning Driver Activity CPU & Memory Usage Disk Occupancy Resource Pool Limit, Reservation, Utilization
- Storage - Key Metrics Storage Metrics Total IOPS (I/O’s per second) Data Reads and Writes Disk Capacity Disk Freespace Not a metric, review the placement of the disks within the enterprise and their access
- VMware tool requirements Data capture/collect/storage Simple, consistent data retrieval Scalable, accessible database Auto-manage data (aggregate, copy, delete) Automated reporting How it was yesterday / last week/ this year How it might be if things carry on the same way Create reports in HTML, Word, Excel, PDF,… Hands-on tool needed Capacity data lives on different levels and you need a tool to bring all the data together
-
Increasing Efficiency
- Increasing Efficiency Influencing the design and implementation of VI within Enterprise 1 vCPU vs. multiple vCPU’s Transparent Page Sharing Rogue and Under-Utilized VMs From Metron paper Using Athene to recycle VM’s Monitor VMs < 10% CPU?
- Virtual CPU Considerations
- Memory Avg. 53 MB used by VM About 70 MB used to support this VM No memory reclamation has been necessary Over 272 MB shared with other VMs
- Rogue or Under-Utilized VMs
- Intelligent Reporting Daily / Weekly / Monthly Dashboard Web Portal Publishing Intelligent and not time consuming
- Resource Pool Report
- Cluster Report - Dashboard
- VMware Cluster Report
- Host Report (Overhead)
- VM CPU Usage
- Capacity Planning proven practices What should everyone be doing Design / 1vCPU – avoid SMP contention, get more density ( 4x more VMs per Host) Design / Use Transparent Page Sharing, get more density (reduce memory needs for VMs) Metric / %READY – highlight saturated hosts (over-dense) Understanding Ready Time Process / Track impact of idle + rogue VMs (remove resources not being used) Process / Capacity management hooked into release and change procedures
- Alerting Determine what to alert on Determine how often to alert Determine what reports to have available when an alert is received Have a tool box of reports that you run when an alert is received Review past reports to determine if it is an anomaly or indication of a future problem where action needs to take place
- Thresholds for alerting
- Intelligent Trending Forecasts Forecasting When will I run out of capacity Business data needed Trending Straight-line trends Trends with a point in time increase “Dog Leg Trend”
- VMware Trend Report
- VMware Dog-leg Trend
-
Intelligent Modeling Forecasts
- Design and Placement Where do I put the next VMs? Assume all things equal, only capacity is different between two clusters What are the goals in terms of capacity (e.g. Cluster 1 <50% full Gold Standard, Cluster 2 <80% full Low Cost Standard) How can I get a suggestion “at a glance” without having to study reports?
- VMware Host Modeling More detailed than cluster level Unit of planning = Host Make workloads = VMs Must be simple to set up and use Must be able to incorporate business information or application data, if available
- Growing virtual workloads 4-CPU ESX Server currently running 5 virtual machines Requirement Grow all workloads by 90% over 10 quarters
- Growing virtual workloads 4-CPU ESX Server currently running 5 virtual machines Requirement Grow all workloads by 90% over 10 quarters Second go… When needed add a new disk to the host and move some of the I/O to it
- Growing virtual workloads 4-CPU ESX Server currently running 5 virtual machines Requirement Grow all workloads by 90% over 10 quarters Second go… When needed add a new disk to the host and move some of the I/O to it Third go… As second go but when needed upgrade CPU power by 50%
- VMware Modeling summary Deal with physical things Guest = workload Hosts = physical machine Cluster = several physical machines Use trends where trends will do Use intelligent trends when non-linear changes occur Incorporate business info/needs
-
ITIL Capacity Management
- What is ITIL?
- Why do I need ITIL? Best practice that will fit my business Repeatable processes Integration Standards
- ITIL® Capacity Management Levels Business Monitor Analyze Tune Implement Application Sizing Demand Management Service Modeling Component Capacity Plan Capacity Management Information System (CMIS)
- Virtualized Demand Management Physical World Operational hours Differential charging Restrict usage Virtual World Operational Demand management Utilizes “new” technology e.g. DRS, VMotion Strategic Demand management Much easier, optimal resource consumption
- Service Response Times Capturing Service Response Times Why are they important? Provide a focus on the end-user experience Provide the Service Level manager with service performance information A valuable feed into the Service Level Agreements (SLA) How are they captured? GUI simulation tools Network sniffers ARMS vCenter AppSpeed
- Modeling: Performance Prediction Non-linear change in Response Time R R Responses are Non-linear Traffic related queuing Lists, cache, freeslots Constraints of OS and network Constraints of RDBMS etc Feedback loops Non-intuitive Utilization U
- Data collection and management Data collection Central vs guest/vm Performance overhead associated with collecting at the VM level Awareness of logical limits that have been applied Capacity Management Information System (CMIS) Storage of all performance data across the enterprise Provide central storage point Performance data Business data Appropriate configuration data
- Key Performance Indicators (KPIs) Business CM % Reduction in physical estate % Reduction in power consumption % Reduction in cost Service CM Service Response Times How this has changed over time Potential reduction following virtualization Component CM No. warning/critical threshold breaches No. of performance related incidents
- Capacity Management Reports Business CM Datacenter level Avoid technical jargon QoS, BMI etc Service CM Cluster/Resource pool Technical utilization vs service response time Provides the “user” perspective Component CM Host/VM Technical in nature i.e. Utilization, memory consumption
- 7 Point Plan for Effective Capacity Management People Have the VMware team talk with the Capacity team. Use this slide deck & VI:OPS Improve your knowledge of ITIL, VI is part of a larger entity. See VIOPS and Metron training webinars Tools Automate laborious activities with a tool such as Athene. See the whole picture and make informed decisions. Fast payback. Monitoring Focus on the key metrics and create processes and reports around them.
- 7 Point Plan for Effective Capacity Management Reporting Set up reports shown in this presentation and meet regularly with Stakeholders to review. Create charts of your capacity trends Use this presentation and VI:OPS as a guide and automate it using a tool such as Athene Modeling Run scenarios on a regular basis. It’s easy to do with a tool. See when capacity and service levels are impacted. How long do you have to react and what decisions need to be made?
- 7 Point Plan for Effective Capacity Management Improve use your new skills and knowledge to improve efficiency of infrastructure. Measure it, use KPI’s in presentation …..Take a bow & get all the glory!
- And finally… VI:OPS http://viops.vmware.com/home/index.jspa VI3.Blueprint Capacity Workshop Metron www.metron-athene.com Tools – Athene Virtual Appliance http://www.vmware.com/appliances/directory/1324


More Related