Download
1 / 20
200 likes | 300 Vues
This presentation by Arthur Marin, Executive Director of NESCAUM, highlights the evolving challenges in air quality planning amid advancing environmental and public health threats. Emphasizing the need for a shift from incremental State Implementation Plans (SIPs) to comprehensive, long-term strategies, the discussion focuses on addressing both traditional pollutants and emerging climate change impacts. With a framework for multi-pollutant planning, the goal is to achieve cost-effective solutions that promote environmental justice and address complex emissions issues. The presentation outlines innovative policy analysis and integrated modeling approaches to guide future air quality initiatives.

E N D
Planning for Transformational Change in an Incremental World Presented By: Arthur Marin, Executive Director NESCAUM Presented To: New Jersey Clean Air Council Annual Public Hearing Trenton, NJ April 14, 2010
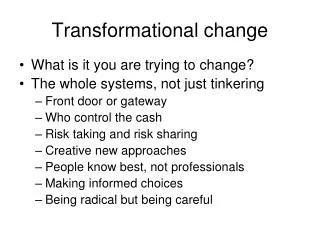
Planning Challenges for Coming Decade • Our region & nation have achieved great success in dramatically reducing the threat from airborne emissions of lead, CO, ozone & acid rain • These successes are tempered by the growing understanding of environmental & public health threats posed by microscopic particles & greenhouse gasses • Now face challenge of virtually eliminating common air pollutants associated with combustion in order to meet our goals
Planning Challenges for Coming Decade • Transitioning from incremental SIP approach to more holistic, longer-term planning • Meeting multiple goals & planning horizons • Achieving near-term requirements while pushing transformational changes • Avoiding short-term decisions that inconsistent with longer-term needs • Addressing complex air pollution issues within a framework that includes broad social and economic considerations
Scale and Scopeof Air Quality Issues • Neighborhoods – environmental justice • Intra-regional – Ozone Transport Region • Inter-regional – OTAG, Section 126 petitions • Continental scale – IJC, US-Canada Accords • Intercontinental – PM & ozone • Global – mercury & GHGs
The “Drivers” Traditional Air Quality Issues • Fine particulate matter & ozone • no known threshold for health impacts • EPA required to reassess NAAQS every 5 years • Mercury • Northeast states already committed to virtual elimination • Toxics • Benzene and other ubiquitous toxins • Regional haze / visibility impairment • Congress requires states to develop plans to restore “pristine” air quality to parks & wilderness areas over long run
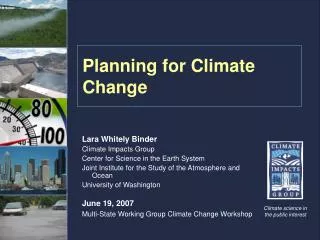
The “Drivers” Climate Change Mitigation • Achieving science-based targets (80%) by mid-century • Will need to fundamentally change the way we produce & use energy, plan our built environment, and live our lives
Effective Planning for Complex Problems • We need to dramatically change the way we conduct air quality planning • “Stove pipe” approaches will no longer work • NESCAUM has designed an approach to multi-pollutant planning to help states think more holistically • Conducted with integrated modeling framework that quantifies environmental, economic & public health impacts
Benefits of Multi-Pollutant Planning • Addresses multiple pollutants, including SO2, NOX, CO2, and Hg • Highlights tradeoffs and co-benefits of policy options • Analyzes the environmental, public health, economic, & energy implications of various pollution control strategies • Allows for multi-sector analyses
Multi-Pollutant Planning Makes Sense • Strategies & technologies that reduce GHGs can also reduce traditional pollutants • Can help design cost-effective approaches that minimize burden on industry & maximize the use of state resources • Can result in better environmental results at lower cost • Promotes integrated energy & air quality planning
Proof of Concept for Multi-Pollutant Policy Analysis Framework • Have developed NE-MARKAL that covers region from DC to Maine • MARKAL is a least-cost optimization linear programming model that focuses on energy systems & technologies • Linked it to atmospheric dispersion, macro-economic, & public health assessment models • Following results are preliminary & intended only to demonstrate capabilities
NESCAUM’s Multi-Pollutant Policy Analysis Framework Goals & Policies emissions NE-MARKAL Energy Model Evolution of Energy System CMAQ Air Quality Model BenMAP Health Benefits Assessment expenditures Ambient Concentrations 12-State REMI Economic Model Wet/Dry Deposition Health Effects Incidence and Cost/Benefit Key Economic Indicators
NE-MARKAL: Energy & Technology Model Oil Refining &Processing Automobiles Fossil Fuels Gasification Combustion Residential Biomass H2 Generation Uranium Nuclear Power Commercial Industry Carbon Sequestration Renewable Resources CleanEnergy Evolution of Today’s Energy System Industry Source: EPA ORD
Reference Case – Power Sector Power Sector Generation Mix Power Sector Capacity Mix by Fuel Type by Fuel Type Annual Average Growth Rate between 2007 and 2030 Annual Average Growth Rate between 2007 and 2030
Policy Scenario: 60% of LDV fleet to electric vehicle by 2029 Transportation Energy Consumption LDV Technology Deployment by Fuel Type by Vehicle Category Time Integrated Change between 2007 and 2030 Time Integrated Change between 2007 and 2030 14
Policy Scenario: 60% of LDV fleet to electric vehicle by 2029 LDV Transportation Sector Cost Breakout LDV Transportation Sector Emissions Changes 15
Policy Scenario: 60% of LDV fleet to electric vehicle by 2029 Electricity Generation by Fuel Type Reference Case EV 16
Policy Scenario: State Renewable Portfolio Standard Power Sector Generation Mix Power Sector Capacity Mix by Fuel Type by Fuel Type Annual Average Growth Rate between 2007 and 2030 Annual Average Growth Rate between 2007 and 2030
Policy Scenario: State Renewable Portfolio Standard Power Sector Cost Breakout Net Generation Change 2007-2030 Relative to Reference Power Sector Emissions Changes Net Capacity Change 2007-2030 Relative to Reference
Bringing it All Together Goals & Policies emissions NE-MARKAL Energy Model Evolution of Energy System CMAQ Air Quality Model BenMAP Health Benefits Assessment expenditures Climate Action Plan Ambient Concentrations 12-State REMI Economic Model Ozone SIP Wet/Dry Deposition Health Effects Incidence and Cost/Benefit Economic Plans Acid Dep Plan IRP Key Economic Indicators AQMP PM2.5 SIP Hg Plan NOx/SO2 2ndary Std Haze,etc.