Satellite Radiance Assimilation
630 likes | 858 Vues
Satellite Radiance Assimilation. John C. Derber Environmental Modeling Center NCEP/NWS/NOAA With input from: Many others. Coverage IR AIRS, METOP, N-17, GOES-11/12. Coverage – Microwave AMSU-A AQUA,N-15,-16,-18, METOP. Coverage – Microwave AMSU-B/MHS N-15,-16,-17,-18,METOP.

Satellite Radiance Assimilation
E N D
Presentation Transcript
Satellite Radiance Assimilation John C. Derber Environmental Modeling Center NCEP/NWS/NOAA With input from: Many others
Atmospheric analysis problem (theoretical) J = Jb + Jo + Jc J = (x-xb)TBx-1(x-xb) + (K(x)-O)T(E+F)-1(K(x)-O) + JC J = Fit to background + Fit to observations + constraints x = Analysis xb = Background Bx = Background error covariance K = Forward model (nonlinear) O = Observations E+F = R = Instrument error + Representativeness error JC = Constraint term
Note! • I will be talking about satellite radiances today. But everything I say today applies with other data sources. The problems may be different, but the problems of similar complexity exist with almost every data set.
Operational radiance data requirements • Requirements for operational use of observations • Available in real time in acceptable format • Assurance of stable data source • Quality control procedures defined (conservative) • Observational errors defined (and bias removed if necessary) • Accurate forward model (and adjoint) available • Integration into data monitoring • Evaluation and testing to ensure neutral/positive impact
Data available in real time in acceptable format • Data formats • WMO acceptable formats – BUFR – CREX (not really relevant) – used by most NWP centers • Almost every satellite program uses a different format • Significant time and resources used understanding/converting/developing formats • If data is not available in time for use in data assimilation system – not useful
NCEP Production Suite Weather, Ocean, Land & Climate Forecast Systems 2007 Current (2007) GDAS NAM anal GFS anal GFS SREF HUR NAM GENS/NAEFS RDAS AQ RTOFS CFS
GFS analysis/forecast cycle • Any data not available by Cut-off will not be used • Later catch up cycle at +6:00 Data Cut-off 2:45 Data Processing 2:46-2:52 Analysis 2:54-3:20 Forecast 3:20-4:06
Rawinsonde Delivery Global Data Cutoff Final Data Cutoff Regional Data Cutoff
POES Data Delivery Global Data Cutoff Locations Received (M) Final Data Cutoff Regional Data Cutoff
Satellite data delivery • Satellite data must wait until ground station within sight to download • Conflicts between satellites • Blind orbits • Proposed NPOESS ground system (METOP currently left out) • SafetyNet is a system of 15 globally distributed receptors linked to the centrals via commercial fiber, it enables low data latency and high data availability
POES Data Delivery Global Data Cutoff Locations Received (M) Next-generation Satellite Data Delivery Regional Data Cutoff
Assurance of stable data source • Changes in data processing can result in changes in observation error characteristics • Notification, testing and provision of test data sets essential prior to changes • For operational satellites – situation OK • For research satellites – means loss of control by instrument/program scientists
Accurate forward model • One of the biggest data assimilation developments in the last 15 years was allowing the observations to be different from the analysis variables • In variational schemes this is done through the K operator • In OI, the same thing could be done – but was only rarely done. • The development allows us to use the observations as they were observed AND allows the use of analysis variables with nice properties.
Forward model - Satellite data • Radiance data differ from many conventional data in that the observations are often indirect observations of meteorological parameters • If x is the vector of meteorological parameters we are interested in and • y is the observation, • then y = K(x,z), • where z represents other parameters on which the observations is dependent • K is the physical relationship between x, z and y
Satellite data • Example – • y are radiance observations, • x are profiles of temperature, moisture and ozone. • K is the radiative transfer equation and • z are unknown parameters such as the surface emissivity (dependent on soil type, soil moisture, etc.), CO2 profile, methane profile, etc. • In general, K is not invertible – thus retrievals. • Physical retrievals – usually very similar to 1D variational problems (with different background fields) • Statistical retrievals – given y predict x using regression
Satellite data • 3-4 D variational analysis can be thought of as a generalization of “physical retrieval” to include all types of data and spatial and temporal variability. • To use data in 2 steps – retrieval and then analysis-- can be done consistently if K is linear and if one is very careful – but is generally suboptimal.
Satellite data • Key to using data is to have good characterization of K – forward model. • If unknowns in K(x,z) – either in formulation of K or in unknown variables (z) are too large data cannot be reliably used and must be removed in quality control. • example, currently we do not use radiances containing cloud signal • Note that errors in formulation or unknown variables generally produce correlated errors. This is a significant source of difficulty.
Satellite data • Additional advantages of using observations directly in analysis system • easier definition of observation errors • improved quality control • less introduction of auxiliary information • improved data monitoring
Forward ModelRadiances • Convert analysis variables to T, q, Ps, u, v, ozone • Interpolate T profiles, q profiles, ozone profiles, u1,v1, Ps and other surface quantities to observation location • Reduce u1 and v1 to 10m values • Calculate estimate of radiance using radiative transfer model (and surface emissivity model) • Tangent linear of calculation – inner iteration • Currently simulation does not include clouds • Apply bias correction • Compare observation to estimate
Satellite Radiance Observations • Measure upwelling radiation at top of atmosphere • Measure deep layers • IR not quite as deep as microwave • New IR instruments (AIRS, IASI, GIFTS) narrower, but still quite deep layers • Deep layers generally implies large horizontal scale
Forward model for RT • RTTOV – CRTM two examples of fast forward models • From CRTM get both simulated radiance and
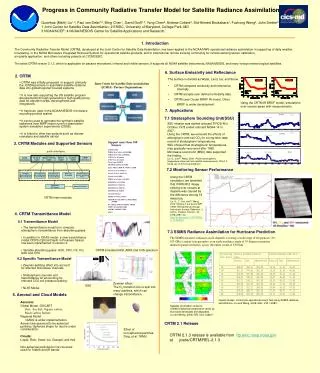
Accounting for size and shap of Field of View • Size and shape of FOV can have a large impact – especially when the FOV covers different surface types. • Emissivity of land and sea quite different so a mixture will give very different results • Power from any point of FOV also important • Microwave FOVs tend to be much larger than IR FOVs • Major problem knowing what you are looking at • Freezing and thawing of lakes • Flooding • Snowfall • Vegetation (leaf water content) • Dew • High enough resolution (in space and time) land use maps • Ability to properly model % surface characteristics in radiative transfer important
SNOW SEA ICE AMSU-A FOV SNOW-FREE LAND WATER MODEL MASK ~ 12KM
IMPACT: ACCOUNTING FOR FOV EX: NOAA-15 AMSU-A, CHANNEL 2 CONTROL: OBS. MINUS GUESS Tb IMPACT: CHANGE IN OBS. MINUS GUESS Tb NORTHERN CANADA NEGATIVE IS IMPROVEMENT
Quality control procedures • The quality control step may be the most important aspect of satellite data assimilation • Data must be removed which has gross errors or which cannot be properly simulated by forward model • Most problems with satellite data come from 3 sources • Instrument problems • Clouds and precipitation simulation errors • Surface emissivity simulation errors
Quality control procedures • IR cannot see through clouds • Since deep layers not many channels above clouds – cloud height difficult to determine • Microwave impacted by clouds and precipitation but signal from thinner clouds can be modeled and mostly accounted for in bias correction • Surface emissivity and temperature characteristics not well known for land/snow/ice • Also makes detection of clouds/precip. more difficult over these surfaces
Quality control procedures(thinning) • Some data is thinned prior to using • Three reasons • Redundancy in data • Radiances • AMWs • Reduce correlated error • AMWs • Computational expense • Radiances
Satellite Data Ingest Five Order of Magnitude Increases in SatelliteData Over Fifteen Years (2000-2015) Daily Satellite & Radar Observation Count Daily Percentage of Data Ingested into Models *2005 Data Level 2 Radar 239.5M 100% 210 M obs Received Data 125 M obs Selected Data Assimilated Data 100 M obs Count (Millions) 17.3M 7% 5.2M 2% 1990 2000 2015 Received = All observations received operationally from providers Selected = Observations selected as suitable for use Assimilated = Observations actually used by models
Observational errors • Observation errors specified based on instrument errors and o-b statistics. Note difference between instrument errors and o-b statistics tend to be quite small. (see later slides) • Generally for satellite data errors are specified a bit large since the correlated errors are not well known. • Bias must be accounted for since it is often larger than signal
Satellite observations • Different observation and error characteristics • Type of data (cloud track winds, radiances, etc.) • Version of instrument type (e.g., IR sounders -AIRS, HIRS, IASI, GOES, GIFTS, etc.) • Different models of same instrument (e.g., NOAA-15 AMSU-A, NOAA-16 AMSU-A)
Bias Correction • The differences between simulated and observed observations can show significant biases • The source of the bias can come from • Biased observations • Inadequacies in the characterization of the instruments • Deficiencies in the forward models • Biases in the background • Except when the bias is due to the background we would like to remove these biases
Bias Correction • Currently we are only bias correcting, the radiances and the radiosonde data (radiation correction) • For radiances, biases can be much larger than signal. Essential to bias correct the data • NCEP uses a 2 step process for radiances (others are similar) • Angle correction (very slowly evolving – different correction for each scan position) • Air Mass correction (slowly evolving based on predictors)
Satellite radiance observationsBias correction • Air Mass prediction equation for bias • Coefficients in equation analysis variable w/ background (previous analysis) values • Predictors • mean • path length (local zenith angle determined) • integrated lapse rate • integrated lapse rate ** 2 • cloud liquid water