Download
1 / 34
350 likes | 500 Vues
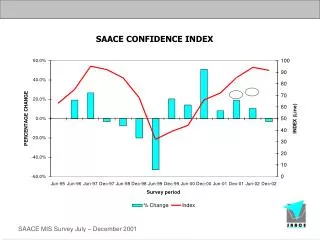
Building Up a Real Sector Confidence Index for Turkey. Ece Oral Dilara Ece Türknur Hamsici CBRT. Outline. Business Tendency Survey (BTS) The Development of the Real Sector Confidence Index. BTS Characteristics. Sample Size: 829 (September 2005) Response Rate: 53 percent (September 2005)

E N D
Building Up a Real Sector Confidence Index for Turkey Ece Oral Dilara Ece Türknur Hamsici CBRT
Outline • Business Tendency Survey (BTS) • The Development of the Real Sector Confidence Index
BTS Characteristics • Sample Size: 829 (September 2005) • Response Rate: 53 percent (September 2005) • Sampling Unit: Senior Managers • Sampling Method: Non-probabilistic Purposive • Data Collection: Mail, e-mail • Answers: 3-point Likert Scale, multiple choice, ranking some factors • Sectors covered: mining, food, textiles, forestry, paper products, chemicals, stone, metals, machinery, energy
What is Business Confidence? The degree of sentiment towards risk taking by business for whatever reason (Pellissier, 2002).
Aim of the Confidence Index The confidence index is constructed to provide an indicator of short-term business conditions for economic policy makers and business managers due to the need of early warning indicators in order to foresee financial and economic crises.
The Development of the Real Sector Confidence Index • Reference Series • Methodology • Emprical Results • Interpretation • Performance • Conclusion
Reference Series Since the aim of the index is to forecast the expansion and contraction periods of the economic activity, an important indicator is to be chosen as the reference series for comparison.
Methodology • Diffusion Indices • Selection of the Potential Series
Diffusion Indices The method that Sutanto (1999) used for Indonesia case is followed. The scales which are in the form of “more optimistic - the same - more pessimistic” or “up – the same – down” are coded: Answers indicating improvement (better off) are scored 2. Answers showing no change are scored 1. Answers showing a worsening condition are scored 0.
Diffusion Indices Iv=Ts/N*100% Iv = Diffusion Index of a Variable Ts = Total Score N = Number of Establishments
The Selection of the Potential Series • Standardization and Smoothing • Seasonality • Cross Correlation Analysis • Peak-Trough Analysis • Low Volatility • Economic Significance • Weighting
Standardization and Smoothing Months for Cyclical Dominance (MCD) moving average procedure can be used.
Seasonality The business survey series may exhibit significant seasonality. Seasonality should be treated as statistical noise, be always tested, and, if necessary, corrected for.
Cross Correlation Analysis The correlation between variables is assumed to be strong when a correlation coefficient is greater than 0.45 in absolute value.
Peak-Trough Analysis Peak-trough analysis includes examination of the behavior of the diffusion indices per question in relation to the cyclical turning points of the reference series.
Low Volatility The standard deviation from median of the lead for each series being low is important because the leading time of the series at turning points should be consistent.
Economic Significance Before the series are accepted as an indicator according to the statistical criteria, there has to be an economic reason.
Weighting Weighting aims to improve reliability by giving higher weight to better components. The weights of the components can be given according to their economic significance or statistical adequacy.
Emprical Results • Reference Series • Standardization and Smoothing • Seasonality • Selection of the Series • Economic Significance • Weighting
Reference Series The industrial production index, which is available on a monthly basis and an important indicator for the economic activity is chosen as the reference series for comparison.
Standardization and Smoothing Most of the diffusion indices show MCD values in the range 2-4.
Seasonality The seasonality of the diffusion indices of each question in BTS is searched. Seasonal influence have little impact on cyclical patterns.
The Selected Series to form Confidence Index • General Economic Situation • Export Oppurtunities • Investment Expenditures • Total Orders • Monthly Stocks of Finished Goods • Employment (trend of next 3 months) • Production (trend of next 3 months) • Goods sold in Domestic Market (trend of last 3 months) • Raw Material Stocks (trend of last 3 months)
Cross Correlation Analysis The correlation coefficients of the selected series and cycles of industrial production index are between 0.45 and 0.666.
Peak-Trough Analysis The mean lead time of the selected indicators are between 0 and 9; the median lead time of the indicators are between 1 and 8 at all turning points.
Economic Significance An algorithm which shows all the process that assumed to be thought by the managers before making production decision and describes the production process for Turkey has been derived.
Weighting The use of the principal component analysis to choose optimal weights illustrate that scores have approximately equal weights.
The Formula used to find the Confidence Index I = ∑Iv / n I : Confidence Index n : number of variables
The Interpretation of the Real Sector Confidence Index • I = 200 (maximum) : all respondents showing an improvement • I = 100 : number of establishments showing an improvement and worsening conditions are balanced, or such that the general condition of respondents are unchanged
The Interpretation of the Real Sector Confidence Index • I > 100 : number of establishments showing an improvement is higher than that showing a worsening condition, or such that the general condition of respondent is better • I < 100 : number of establishments showing an improvement is lower than that showing a worsening condition, or such that the general condition of respondent is worse
Conclusion The real sector confidence index has the leading indicator capability for the economic activity and it is an indicator for the business confidence based on the Business Tendency Survey.
References • Nilsson, R. (1999). “ Business Tendency Surveys and Cyclical Analysis”. Business Tendency Surveys, Proceedings of the First Joint OECD-ADB Workshop, Manila, November. • Pellissier,G.M.(2002),“Measuring Business Confidence in South Africa”, Presented at the 26th CIRET Conference, Taipei, October. • Sutanto, A. (1999). “Business Confidence Index, Consumer Confidence Index and Index of Leading Indicators: An Experiment for Indonesia”. Business Tendency Surveys, Proceedings of the First Joint OECD-ADB Workshop, Manila, November.