Understanding Statistics and Probability: Key Concepts Explained
This guide covers essential topics in statistics and probability including slope, linear equations, permutations, combinations, and measures of variation. It breaks down complex formulas for probability and slope, explains the concepts of horizontal and perpendicular lines, and introduces terms like matrix and scalar multiplication. With examples and clear definitions, learn how to evaluate combinations, understand the rate of change, and visualize data through histograms and box-and-whisker plots. Essential for students and enthusiasts looking to deepen their mathematical understanding!

Understanding Statistics and Probability: Key Concepts Explained
E N D
Presentation Transcript
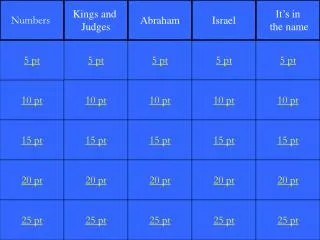
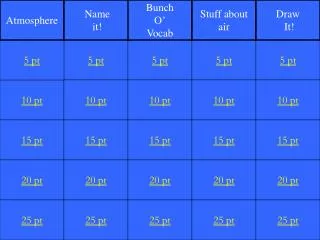
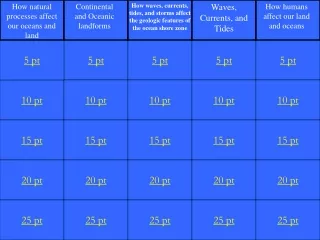
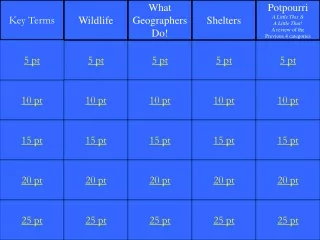
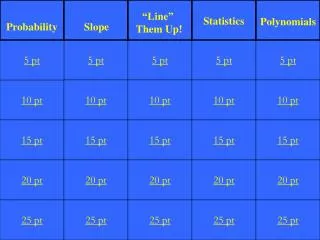
Statistics Probability Slope “Line” Them Up! Polynomials 5 pt 5 pt 5 pt 5 pt 5 pt 10 pt 10 pt 10 pt 10 pt 10 pt 15 pt 15 pt 15 pt 15 pt 15 pt 20 pt 20 pt 20 pt 20 pt 20 pt 25 pt 25 pt 25 pt 25 pt 25 pt
Number of successful outcomes Total possible outcomes
An arrangement or listing in which order is important.
This is the formula to evaluate a combination.
What is ?
The slope for this set of ordered pairs (4, 8) and (-6, 3). (reduce if possible)
Y – 2 = -1/3 ( x + 5 ) The slope of this linear equation.
DAILY DOUBLE!!!!! This is the inverse slope of a horizontal line.
Another term for slope that describes how a quantity is changing over time.
An equation in the form Ax + By = C
y1 – y2 x1 – x2 M=
The number of solutions for the above system of equations.
This type of line has a constant value for the y-coordinate.
These two equations create these type of lines. Y= ½ x –7 Y = -2x + 5
A rectangular arrangement of numbers in rows and columns.
Measures that describe the spread of values in a set of data.
A number, a variable, or a product of a number and one or more variables.
This is done when multiplying two powers that have the same base.
Simplify: x7y12 x6y3
DAILY DOUBLE!!!!! Solve:
(x-5) (x+7) = ( x - 5 ) ( x + 7 ) The above is an example of this method.