Mining SNPs from EST Databases
Mining SNPs from EST Databases. Picoult-Newberg et al. (1999). Strategy to Identify SNPs. Used ESTs derived from 19 different cDNA libraries to assemble 300,000 distinct sequences and identified 850 mismatches.


Mining SNPs from EST Databases
E N D
Presentation Transcript
Mining SNPs from EST Databases Picoult-Newberg et al. (1999)
Strategy to Identify SNPs • Used ESTs derived from 19 different cDNA libraries to assemble 300,000 distinct sequences and identified 850 mismatches. • ESTs are short single pass cDNA sequences generated from randomly selected library clones. • EST contigs were generated using Phrap, a sequence alignment and contig assembly program. (Picture of EST alignment) • To distinguish between true SNPs and artifacts within the cDNA, a series of filters were applied.
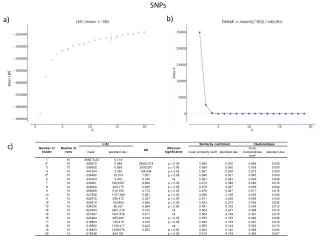
Filter Types Used • Filter Test: 100 contigs were randomly selected and inspected with Consed after filtration. Candidate SNPs were considered real if trace data was of high quality and passed all four filters. • Filter 1: Eliminates clusters of mismatches that often occur in regions of low-quality trace data. • Filter 2: Identifies sequence mismatches by either base substitution type or insertion/deletion type. • Filter 3 & 4: Addressed quality of each base call relative to its position and frequency in a contig. First 100 bases discarded. Consed view of a contig containing a high quality mismatch (A vs. T). The mismatch has been confirmed as a common SNP.
Filter Types Used • Focused primarily on base substitutions (A/G or T/C) as these types make up greater than 60% of all polymorphisms
Conclusions • Successfully demonstrated a strategy for the rapid identification and verification of SNP-based genetic markers using EST data sources. • Possible that this approach could identify sequence variants that lead to amino acid substitutions that may lead to functional differences. • To show effectiveness of this strategy, the throughput of SNP confirmation was increased by using Genetic Bit Analysis (GBA).
Overlapping Genomic Sequences: A Treasure Trove of Single-Nucleotide Polymorphisms Taillon-Miller et al. (1998)
SNPs in Overlapping Clones • Developed strategy to identify SNPs in overlapping BAC clones. (Picture) • Sequenced three sets of overlapping clones, 153 polymorphisms (1 per 1.3 kb) were discovered to be unique (substitution, insertion or deletion). • 55 were discarded by computer analysis (filters). • The oligonucleotide selection program (osp) was used to design primers to amplify the 98 remaining SNPs. • 30 SNPs were in regions with no suitable amplimers. • In all, 44 STSs were developed to amplify the remaining 68 SNPs, with 16 STSs containing 2 SNPs and 8 STSs contained 3 or more SNPs. All 68 SNPs were present in at least one of three populations studied.
SNPs in Overlapping Clones 30 individuals
Conclusions • Informative SNPs can be found by using overlapping regions of clones because BACs are typically from different individuals. • They described a marker every 4.8 kb. • Many of the SNPs have different population frequencies • This approach has many advantages because 1) high quality sequence data because every base in overlap is sequenced at least twice; 2) SNP data is generated by analyzing existing data; 3) SNPs are derived from long range sequence data and these markers are precisely mapped. • SNP markers can be found in overlapping genomic sequence, it is highly efficient and cost effective. Only two steps involved (develop STSs around known SNPs and characterize them in populations).
An SNP map of the human genome generated by reduced representation shotgun sequencing Taillon-Miller et al. (1998)
Reduced Representation Shotgun Sequencing • RRS re-samples specific subsets of the genome and compares the resulting sequences using a highly accurate SNP detection algorithm. • Prepare subsets of the genome (reduced representation), by performing restriction digest to generate restriction fragment lengths between 500 to 600 bp. (Picture) • Computer analysis of 517 megabases yielded 3847 BglII fragments. • Thus SNPs can be discovered by mixing DNA from many individuals, prepare library of sized restriction fragments, and randomly sequencing clones. • Defined a neighborhood quality standard (NQS) to cut down on base calling errors. Good sequence results in higher accuracy.
Reduced Representation Shotgun Sequencing • Used polymorphism free BAC DNA to evaluate NQS. Any ‘SNPs’ would represent base calling errors. • Base calls within ‘good neighbors’ were more accurate than predicted by Phred.
Conclusions • Demonstrated a new method for re-sampling loci without PCR, and for detecting SNPs with high accuracy in the resulting alignments. • RRS can be configured for any organism. • SNPs discovered by RRS offer the potential for reduced representation genotyping without locus specific amplification.