Download
1 / 8
80 likes | 202 Vues
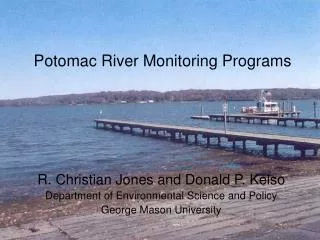
Potomac River Monitoring Programs. R. Christian Jones and Donald P. Kelso Department of Environmental Science and Policy George Mason University. Current Potomac River Monitoring Programs. Gunston Cove Study Tidal Occoquan River – Belmont Bay Continuous Monitor.

E N D
Potomac River Monitoring Programs R. Christian Jones and Donald P. Kelso Department of Environmental Science and Policy George Mason University
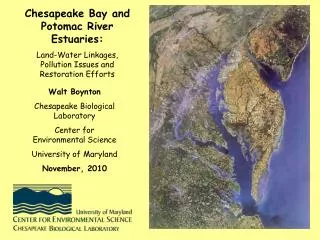
Current Potomac River Monitoring Programs • Gunston Cove Study • Tidal Occoquan River – Belmont Bay Continuous Monitor Department of Environmental Science & Policy George Mason University
Gunston Cove Area of the Tidal Freshwater Potomac River • Gunston Cove • Depth 1-2 m • Reduced tidal velocities • Sparse SAV • River Channel • Depth 12-15 m • Strong tidal velocities • SAV along margins
Since 1984, water quality, plankton, fish and benthos have been monitor-ed on a generally semimonthly basis at a number of sites in the Gunston Cove area. Noman Cole PCP * Monitoring Site Key: ● water quality and plankton ▲fish trawl ■ fish seine
Water Quality Variables Temperature Conductivity Dissolved oxygen pH N: NO3-, NH4+, organic N P: PO4-3, Total P BOD TSS, VSS Chloride Alkalinity Plankton Variables Surface Chlorophyll a Chlorophyll a Photosynthetic rate (mgC/L/hr) at light sat. PBmax (mgC/mgChla/hr) Phytoplankton cell density by species Phytoplankton biovolume by species Microzooplankton (44 μm net) abundance Macrozooplankton (202 μm net) abundance Water Quality and Plankton VariablesGMU Gunston Cove Study • Fish Trawling and Seining
Profiles and chl a: Semimonthly at 2 sites Nutrient samples (analyzed as part of DNR program): Semimonthly at 2 sites Fish seining and trawling at 3 sites each semimonthly Phytoplankton samples will preserved for possible later analysis Zooplankton will not be done Gunston Cove Study - 2006
Tidal Occoquan River – Belmont Bay Continuous Monitor • YSI 6600 connected to YSI 6200 with cell phone connection • Sampling and communication protocol integrated with Md DNR “eyes on the bay” • Staffed by Sara Clark, GMU graduate assistant and master’s thesis student • Nutrient analyses on a weekly to biweekly basis coinciding with sonde exchange