Sample Standard Deviaiton
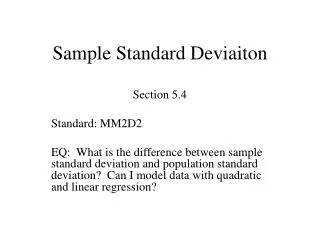
Sample Standard Deviaiton. Section 5.4 Standard: MM2D2 EQ: What is the difference between sample standard deviation and population standard deviation? Can I model data with quadratic and linear regression?.

Sample Standard Deviaiton
E N D
Presentation Transcript
Sample Standard Deviaiton Section 5.4 Standard: MM2D2 EQ: What is the difference between sample standard deviation and population standard deviation? Can I model data with quadratic and linear regression?
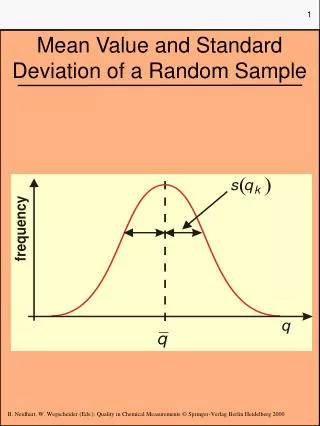
The standarddeviation is a number that marks a distance on the measurement scale. In very general terms it is the average difference between each score and the mean average. A standard deviation is central to many of the statistics used to make inferences and test hypotheses. In statistics, it is very important to distinguish between population and sample. A population is defined as all members of a specified group. Population is the whole group.
A sample is a part of a population that is used to describe the characteristics of the whole population. The size of the sample can be less than 2%, or 20%, or 60% of the population, but it is never the whole population. Standard Deviation for a population versus a sample: When a set of data contains all of the possible data points for a population the calculation of standard deviation provides a specific value that characterizes that population.
Such a specific value for a statistic is called a parameter. You would normally calculate the population standard deviation if (1) you have the entire population or (2) you have a sample of a larger population but you are only interested in this sample and do not wish to generalize your findings to the population.
The symbol σ is used to identify the population standard deviation, , and σ2 is the population variance. If all you have is a sample but you wish to make a statement about the population standard deviation from which the sample is drawn, then you need to use the sample standard deviation. In this instance, one (1) is subtracted from the N number of cases. For small samples this N – 1 tends to increase the standard deviation slightly, making it a conservative estimate of the population’s parameter.
As sample size increases the effect of N – 1 declines and the results of the two formulas converge towards the population parameter. The symbol S is used to identify the sample standard deviation, , and S2 is the sample variance. Examples: (1). A teacher sets an exam for her students. The teacher wants to summarize the results the students attained as a mean and standard deviation. Which standard deviation should be used? Population Standard Deviation, σ
(2). A researcher has recruited males aged 45 to 65 years old for an exercise training study to investigate risk markers for heart disease, e.g. cholesterol. Which standard deviation should be used? (3). One of the questions on a national consensus survey asks for the respondent’s age. Which standard deviation should be used to describe the variation in all ages received from the consensus? Sample Standard Deviation, S Population Standard Deviation, σ
(4). Bob has invested in 10 funds and wants to compute the standard deviation of last year’s returns on his investments. Which standard deviation should be used? (5). Bob wants to determine the standard deviation of last year’s returns for all equity funds in the world. Which standard deviation should be used? Population Standard Deviation, σ Sample Standard Deviation, S
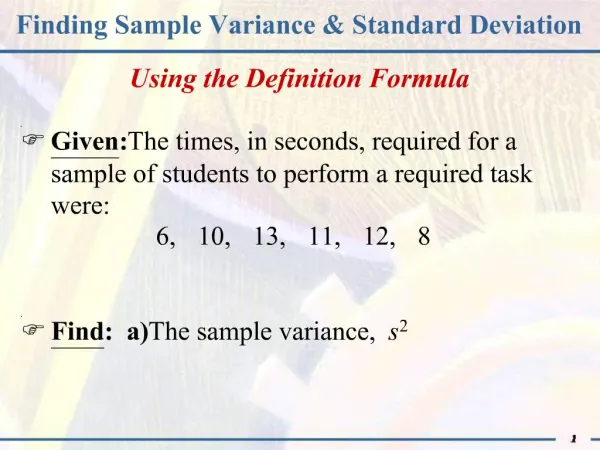
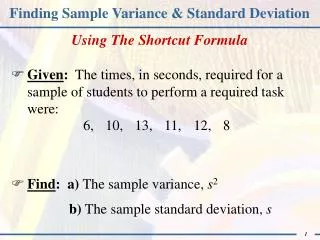
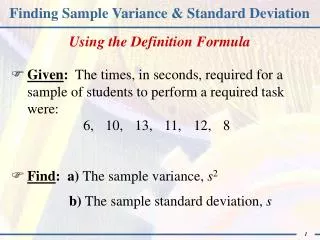
(6). During his short football career, a running back had 7 rushes of 6 yards, 14 yards, 11 yards, 20 yards, 22 yards, 1 yard, and 3 yards, respectively. What is the standard deviation of this set of data? (7). A random sample of 7 students had the following scores on a quiz: 8 points; 0 points; 8 points; 6 points; 7 points; 6 points; 2 points. Determine the standard deviation of the sample of quiz scores. σ ≈ 7.56 S ≈ 3.09
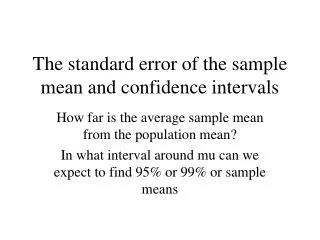
The mean and standard deviation of the sample means can be used to estimate the mean and standard deviation of the population. If the mean of the same means is and the standard deviation of the sample means is , the population mean can be estimated by using and the standard deviation can be estimated by using where n is the sample size.
(8). In a set of 10 random samples of winning scores for games played in a professional basketball league, the sample size is 6, the sample mean is 97.5 and the sample standard deviation is 5.2 points. Estimate the mean and standard deviation of all the winning scores? Mean of all winning scores is Standard deviation of all the winning scores is = 97.5
(9). The manager for a chain of skateboard shops took 10 random samples from her data about the number of skateboards sold per week at one of the stores in her chain. The sample means for the store were: 17.5, 18.25, 8.0, 22.25, 7.75, 18.25, 24.0, 28.4, 16.0, 16.25. Calculate the sample mean and sample standard deviation for this set. If the sample size was 4, use the sample mean and sample standard deviation to estimate the mean and standard deviation for the entire year’s data.
Mean = and sample standard deviation is Population mean ≈ and population standard deviation ≈ Note: the distribution of the sample means has less variability than the population distribution. 17.67 6.44 17.67
Bivariate data are data that involve two variables that may be related to each other. Data is often written in a two-column format. If the increases or decreases in the ordered pairs are at a constant rate, then a linear equation for the data can be found. We have determined lines of best fit by “eyeballing” the data as well as determining the median-median line. Using a graphing calculator, you can calculate an exact line of best fit called the “line of regression.”
To determine if a linear or quadratic model is appropriate, look at the rate of change in the differences of x and y. If the ratio of first differences is relatively constant, a linear model should be selected. If the ratio of second differences is relatively constant, a quadratic model should be selected. Examples: Determine a curve of best fit for each set of data:
4 1 2 12 25 5 Ratio of differences: 6, 6.25, 5 Regression Line: y = 6.06x + 2.92
Examples: Determine a curve of best fit for each set of data: 1 1 1 1 1 1 1 1 -26 -30 -2 -6 -10 -14 -18 -22 -4 -4 -4 -4 -4 -4 -4 Ratio of differences approximately: -4 Quadratic Regression: y = -2x2 +0x + 128