Download
1 / 75
760 likes | 930 Vues
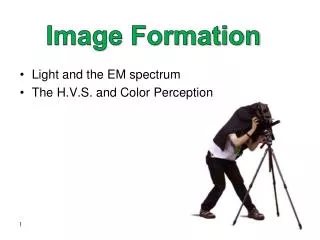
Light and the EM spectrum The H.V.S. and Color Perception. Image Formation. What is an Image ?. An image is a projection of a 3D scene into a 2D projection plane .

E N D
Light and the EM spectrum The H.V.S. and Color Perception Image Formation
What is an Image ? • An image is a projection of a 3D scene into a 2D projection plane. • An image can be defined as a 2 variable function I(x,y) , where for each position (x,y) in the projection plane, I(x,y) defines the light intensity at this point.
Camera trial #1 film scene Put a piece of film in front of an object. source: Yung-Yu Chuang
barrier Pinhole camera pinhole camera film scene Add a barrier to block off most of the rays. • It reduces blurring • The pinhole is known as the aperture • The image is inverted source: Yung-Yu Chuang
The Pinhole Camera Model (where) (x,y) Y d X (x,y,z) center of projection (pinhole) d Z d – focal length
The Shading Model (what) Shading Model: Given the illumination incident at a point on a surface, what is reflected?
Shading Model Parameters • The factors determining the shading effects are: • The light source properties: • Positions, Electromagnetic Spectrum, Shape. • The surface properties: • Position, orientation, Reflectance properties. • The eye (camera) properties: • Position, orientation, Sensor spectrum sensitivities.
The Light Properties Newton’s Experiment, 1665 Cambridge. Discovering the fundamental spectral components of light. (from Foundations of Vision: Brian Wandell, 1995.
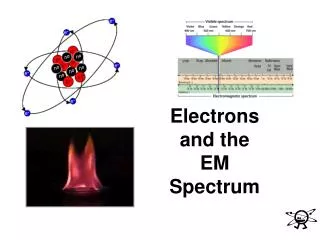
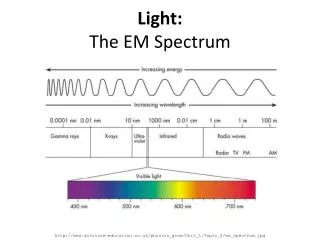
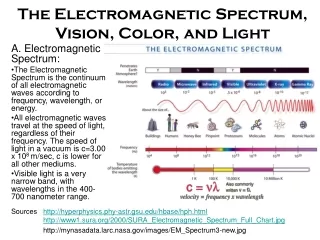
Electromagnetic Radiation - Spectrum Wavelength in nanometers (nm)
Monochromators Monochromatorsmeasure the power or energy at different wavelengths
Spectral Power Distribution (SPD) The Spectral Power Distribution(SPD) of a light is a function e()which defines the relative energy at each wavelength. 1 0.5 Relative Power 0 400 500 600 700 Wavelength (l)
1 1 0.5 0.5 0 0 400 500 600 700 400 500 600 700 Blue Skylight Tungsten bulb 1 1 0.5 0.5 0 0 400 500 600 700 400 500 600 700 Red monitor phosphor Monochromatic light Examples of Spectral Power Distributions
Reflected Light Incoming Light Transmitted Light The Surface Properties • Interactions between light and matter depends on the physical characteristics of light as well as the matter. • Three types of interactions: • Reflection • Absorption • Transmittance
The Bidirectional Reflectance Distribution Function (BRDF) • A BRDF describes how much light is reflected when light makes contact with a certain material Spectral radiance: quantity of light reflected in direction (e,e) Spectral irradiance: quantity of light arriving from direction (i,i)
Simplified Model normal Specular reflection Incident light Diffuse reflection • Diffuse (lambertian) reflection • Reflected randomly between color particles • reflection is equal in all directions. • Specularreflection • mirror like reflection at the surface
Simplified rendering models: reflectance Often are more interested in relative spectral composition than in overall intensity, so the spectral BRDF computation simplifies a wavelength-by-wavelength multiplication of relative energies. = .* B. Freeman, and Foundations of Vision, by Brian Wandell,
Spectral Property of Lambertian Surfaces Yellow Red Blue Gray Wavelength (nm) Surface Body Reflectances (albedo)
Some reflectance spectra Forsyth, 2002
Lens Cornea Fovea Optic Nerve Vitreous Pupil Humor Optic Disc Iris Retina Ocular Muscle The Eye Properties • Cornea - קרנית • Pupil - אישון • Iris - קשתית • Retina - רשתית
The Visual Pathway Retina Optic Nerve Optic Chiasm Lateral Geniculate Nucleus (LGN) Visual Cortex
Eye v.s. Camera Yaho Wang’s slides
The Human Retina cones rods horizontal bipolar amacrine ganglion light
Retina contains 2 types of photo-receptors Cones: Day vision, can perceive color tone – Rods: Night vision, perceive brightness only
Cone Spectral Sensitivity 1 L M S 0.75 Relative sensitivity 0.5 0.25 0 400 500 600 700 Wavelength (nm) • Cones: • High illumination levels (Photopic vision) • Sensitive to color (there are three cone types: L,M,S) • Produces high-resolution vision • 6-7 million cone receptors, located primarily in the central portion of the retina M • A side note: • Humans and some monkeys have three types of cones (trichromatic vision); most other mammals have two types of cones (dichromatic vision). • Marine mammals have one type of cone. • Most birds and fish have four types. • Lacking one or more type of cones result in color blindness.
Rod Spectral Sensitivity 1 0.75 Relative sensitivity 0.5 0.25 0 400 500 600 700 Wavelength (nm) • Rods: • Low illumination levels (Scotopic vision). • Highly sensitive (respond to a single photon). • Produces lower-resolution vision • 100 million rods in each eye. • No rods in fovea.
Photoreceptor Distribution Foveal Periphery photoreceptors S - Cones rods L/M - Cones
Cone Receptor Mosaic(Roorda and Williams, 1999) L-cones M-cones S-cones
Cone’s Distribution: • L-cones (Red) occur at about ~65% of the cones throughout the retina. • M-cones (green) occur at about ~30% of the cones. • S-cones (blue) occur at about ~2-5% of the cones (Why so few?). 4 x 10 18 rods cones 14 Distribution of rod and cone photoreceptors 10 Receptors per square mm 6 2 -60 -40 -20 0 20 40 60 Degrees of Visual Angle fovea
The Cone Responses Assuming Lambertian Surfaces Illuminant Surface Sensors Output e() – Fixed, point source illuminant k() –surface’s reflectance l(),m(),s() – Cone responsivities
800 200 400 100 0 0 400 500 600 700 400 500 600 700 Metamer - two lights that appear the same visually. They might have different SPDs (spectral power distributions). Tungsten light Monitor emission Power Wavelength (nm) The phosphors of the monitor were set to match the tungsten light.
The Trichromatic Color Theory Trichromatic: “tri”=three “chroma”=color color vision is based on three primaries (i.e., it is 3D). Thomas Young (1773-1829) - A few different retinal receptors operating with different wavelength sensitivities will allow humans to perceive the number of colors that they do. Suggested 3 receptors. Helmholtz & Maxwell (1850) - Color matching with 3 primaries.
Given a set of 3 primaries, one can determine for every spectral distribution, the intensity of the guns required to match the color of that spectral distribution. The 3 numbers can serve as a color representation. - + - + - + Color Matching Experiment test match R() G() T() B() Primaries
Color matching experiment 1 from: Bill Freeman
Color matching experiment 1 p1 p2 p3 from: Bill Freeman
Color matching experiment 1 p1 p2 p3 from: Bill Freeman
The primary color amounts needed for a match Color matching experiment 1 p1 p2 p3 from: Bill Freeman
Color matching experiment 2 from: Bill Freeman
Color matching experiment 2 p1 p2 p3 from: Bill Freeman
Color matching experiment 2 p1 p2 p3 from: Bill Freeman
p1 p2 p3 Color matching experiment 2 The primary color amounts needed for a match: We say a “negative” amount of p2 was needed to make the match, because we added it to the test color’s side. p1 p2 p3 p1 p2 p3 from: Bill Freeman
1 0.5 0 400 500 600 700 1 0.5 0 400 500 600 700 1 0.5 0 400 500 600 700 Color matching experiment for Monochromatic lights Primary Intensities
3 r(l) 2 Primary Intensity g(l) b(l) 1 0 400 500 600 700 Wavelength (nm) The Color Matching Functions (CMF) Stiles & Burch (1959) Color matching functions. Primaries are: 444.4 525.3 and 645.2 Problems: Some perceived colors cannot be generated. This is true for any choice of visible primaries.
The superposition principle Foundations of Vision, by Brian Wandell, Sinauer Assoc., 1995 from: Bill Freeman
Observation - Color matching is linear: if (SP) then (S+NP+N) if (SP) then ( S P) LetT()=c(-0)+d(-1) a double chromatic color: How should we adjust the 3 primaries? d c 1 0
Outcome 1: Any T() can be matched: Outcome 2: CMF can be calculated for any chosen primaries U(), V(), W():