Download
1 / 32
320 likes | 447 Vues
Pain Perception and Chronic Pain. Tara Jo Manal PT, OCS, SCS. Epidemiology. 97% causes are unknown 2% are disk 1% Facet ~30% require conservative management 1% surgery All others recover spontaneously. Epidemiology. 30% workers miss time due to back injury 2-4% change jobs as a result

E N D
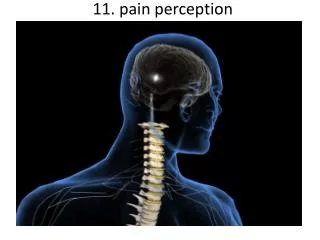
Pain Perception and Chronic Pain Tara Jo Manal PT, OCS, SCS
Epidemiology • 97% causes are unknown • 2% are disk • 1% Facet • ~30% require conservative management • 1% surgery • All others recover spontaneously
Epidemiology • 30% workers miss time due to back injury • 2-4% change jobs as a result • Workers off work >6months have 50% chance of returning • Decreases to 25% after 1 year • 88% first time injury pain-free in 6 wks • 98% in 24 weeks • 99% in 52 weeks
Nonorganic Signs • 3 or more are considered + test • Regional Disturbance- Sensory or motor changes/weakness that is nonanatomical • Superficial/nonanatomic tenderness • Light touch or deep tenderness over a widespread area, nonanatomic
Nonorganic Signs • Simulation • Axial Loading • Low back pain reported with pressure on the patient’s head while standing
Nonorganic Signs • Simulation • Rotation • Pain in the low back when the shoulders and pelvis are rotated in the same plane as the patient stands
Nonorganic Signs • Distraction • Straight Leg Raising • Inconsistent limitation of straight leg raising in supine and seated positions
Nonorganic Signs • Overreaction • Disporportinate verbalization, facial expressions, muscle tension, collapsing, sweating, during the examination
Do you get pain in your tailbone? Do you have numbness in your entire leg (front, side, and back) at the same time? Do you have pain in your entire leg (front, side, and back) at the same time? Does your whole leg give way? Have you had any time during this episode when you have very little back pain? Have you had to go to the ER due to back pain? Has all treatment for your back pain made you worse? Nonorganic Symptom Descriptors
Abnormal Illness Behavior • Maladaptive overt illness related behavior which is out of proportion to the underlying physical disease and more readily attributable to associated cognitive and affective disturbances
Purpose of Nonorganic Testing • When the test is negative they can “rule out” abnormal illness behavior • Not intended to “rule in” only identify those at risk for an unsuccessful treatment outcome • Fritz 2000 Acute LBP • 2 or more signs • 3 or more symptoms • Increase likelihood of not returning to work by 6-10%
Psychosocial Variables in LBP • Bigos et al 1986 • Boeing plant in Washington • Analyzed 4645 injuries (900LB) over 15months • Correlation between back injury and poor appraisal ratings (6 mo before injury) • Designed prospective study to look at 3020 employees.. 279 developed back injury
Psychosocial Factors Personality Inventories Family Support Co-worker support Job satisfaction Personal Factors Isometric strength Flexibililty Aerobic Capacity Height Weight Psychosocial Variables in LBP
Psychosocial Variables in LBP • Psychosocial Factors (job employment) had strongest influence • Poor satisfaction – 1.85 times more likely to report a back injury • 15% variance explained by Job Satisfaction • 85% unaccounted for (not job satisfaction) • Marras 1993- 400 repetitive lifting jobs in 48 industries (1.56 odds ratio for job satisfaction)
Psychosocial Variables in LBP • Marras 1995 • 400 lifting jobs classified as low, medium, or high risk jobs • 5 measures reflected the classification • Maximum load moment, maximum lateral trunk angular velocity, average trunk twisting velocity, lifting frequency, maximum saggital trunk angle) • Saw job satisfaction 1.32 – 1.48 but the measures above could predict 10times more likely to be injured
Psychosocial Variables in LBP • Norman 1998 • Auto plant- 104 cases and 130 random controls • Biomechanical data, psychosocial, and psychophysical (perceived stresses) • Factors • Peak lumbar shear force 1.7 • Lumbar disc compression over shift 2.0 • Poor workplace social environment 2.6 • Higher job satisfaction 1.7
Psychosocial Variables in LBP • Factors • Higher coworker support 1.6 • Perception of being more educated 2.2 • Perception of higher physical exertion 3.0 • Capacity of worker relative to job • 45% of variance is explained by these factors • 12% psychosocial factors • 31% biomechanical • Body mass index 2.0 • Prior compensation claim 2.2
Chronic Pain and Disability • Mendelson 1982 LBP persists after legal settlement • Hadler 1991 relationship between medical examiner determining reward and patient cases the patient to act disabled • Werneke and Hart 2001- pain patterns that centralize or not are more predictive of chronicity than psychosocial factors
Chronic Pain • White and Gordon 1982 • 85% of disabling LBP cases have no definitive pathoanatomical diagnosis • LBP patients have “nonorganic signs” suggesting psychological disturbances • Poor diagnostic techniques make solid diagnosis difficult
Biomechanical and Psychosocial Factors • Psychological and Pain are linked • Marras 2000 • Personality and psychosocial factors increase spinal loads by up to 27% • Muscular co-contraction • Seen at moderate lifting loads, at heavy loads gone
First-time Injury Risk Factors • Best indicator of back trouble is previous back trouble (~60%) • Police officers • Body armor is increased risk • Greater than 2hrs in car is increased risk • Falls • Longer sick time and greater recurrence than other types of first-time LBP • Age and Gender • Females sustain 2/3 load males • 60year old sustain 2/3 of 20 year old • 35%female in heavy loads and 19% males
First-time Injury Risk Factors • Increased joint mobility and decreased lumbar endurance affected first time LBP • Vibration( esp. sitting) • Remaining sedentary • 8% increase white collar • 14% decrease for blue collar • Static work postures • Esp. mild trunk flexion 20°-45° • Frequent bending and twisting • Spine motion not torso • Lifting • Pulling • Pushing
Chronic Changes After Injury • Muscular Function • Delayed onset of trunk muscles to sudden activity • Anatomical changes • Multifidus atrophy • Muscular Imbalance • Increased BMI • Flexor/Extensor Ratio • Lateral Bend Endurance • Loss Flexion ROM
Biomechanics and Psychosocial Factors • Biomechanical Factors are associated with LBP • Psychosocial Factors play role and may related more to episodes after initial • The 2 influence each other • LB tissue damage can initiate a cascade of changes that can cause pain and intolerance for years • Many times of damage are not detected and others are over interpreted
Chronic Pain • Emotional distress • Depression • Failed Treatment • Adoption of a sick role • Self-sustaining condition
Nociception Pain Suffering Pain Behavior Physical Problem Distress Illness Behavior Sick Role Pain Models
Fear Avoidance • Pain perception • Sensory • Emotional • Synchronous and Proportional • Disassociation • Pain is out of proportion to injury • Patient fears pain and avoids it
Fear of Pain • Stressful life events • Personality • Previous pain history • Normal pain coping strategy • Confrontation resumes activity as tolerated • Avoidance of activities that may cause pain
Fear Avoidance Belief Questionnaire • FABQ • 16 Items 0-6 (higher = avoidance) • 7 Item work subscale • My work might harm my back • 4 Item physical activity subscale • I should not do physical activity that might make my pain worse
Fear Avoidance Belief Questionnaire • FABQ • No difference found between cervical and lumbar • Patients with cervical spine disorder had weaker relationships with pain and disability than lumbar • Differences seen with gender, symptom onset and payer type
Fear Avoidance Belief PT • Educate the patient LBP is a common condition not a serious disease • Back Book • Graded Exercise • Those with higher Fear Avoidance Belief benefit from FABPT
Depression • Depressed mood most of the day, nearly every day • Markedly diminished interest or pleasure in almost all activities most of the day, nearly every day (as indicated by either subjective account or observation by others of apathy most of the time) • Significant weight loss or gain • Insomnia or hypersomnia • Psychomotor agitation or retardation • Fatigue (loss of energy) • Feelings of worthlessness (guilt) • Impaired concentration (indecisiveness) • Recurrent thoughts of death or suicide