
Detection of Spatial Patterns: Effects of Phase Congruency in Visual Stimuli
This study investigates the impact of phase congruency on the detection thresholds of visual patterns, focusing on gratings composed of multiple spatial frequency components. Phase-congruent gratings (e.g., edges, lines) exhibited significantly lower detection thresholds compared to phase-incongruent patterns, indicating potential specialized mechanisms for edge and line detection. The experiment utilized a two-interval forced-choice method and measured thresholds with a staircase procedure, revealing insights into visual processing and the role of phase in the detectability of spatial contrasts.

Detection of Spatial Patterns: Effects of Phase Congruency in Visual Stimuli
E N D
Presentation Transcript
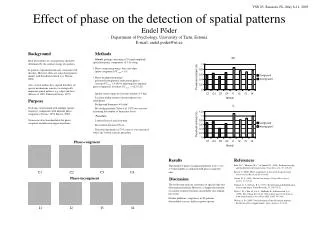
VSS 05, Sarasota, FL, May 6-11, 2005 Effect of phase on the detection of spatial patternsEndel PõderDepartment of Psychology, University of Tartu, EstoniaE-mail: endel.poder@ut.ee Background Ideal detectability of visual patterns should be determined by the contrast energy of a pattern. In general, experimental data are consistent with this idea. However, there are some discrepancies, mainly with broadband stimuli (e.g. Watson, 2000). Also, several authors have argued that there are special mechanisms sensitive to ecologically important spatial patterns, e.g. edges and lines (Burr et al, 1989; Tolhurst & Dealy, 1975). Purpose To design visual stimuli with multiple spatial-frequency components with minimal phase-congruency(Owens, 1994; Kovesi, 2000) . To measure detection thresholds for phase-congruent and phase-incongruent patterns. • Methods • Stimuli: gratings consisting of 32 equal-amplitude spatial-frequency components (0.5-16 c/deg). • Phase-congruent gratings: lines and edges • (phasecongruency PC max = 1.0) • Phase-incongruent gratings: • generated from patterns with random phases • (average PC max = 0.38) by adjusting for a minimalphase congruency (resultant PC max = 0.21-0.22). • Spatial extent (sigma of Gaussian window) 1.5 deg. • Location within window (absolute phase) was randomized. • Background luminance 48 cd/m2 • Bit-stealing method (Tyler et al, 1992) was used for increasing the number of luminance levels. • Procedure: • 2-interval forced choice method • Presentation duration 250 ms. • Detection thresholds (of 79% correct) were measured with 1-up 3-down staircase procedure Phase-congruent Results Thresholds for phase-incongruent patterns were 1.2 to 1.5 times higher as compared with phase-congruent ones. Discussion The results may indicate a presence of special edge-line detecting mechanisms. However, a simple non-linearity of contrast response function can probably also explain the results. Further problems: congruency in 2D patterns, detectability in noise, different power spectra. References Burr, D. C., Morrone, M. C., & Spinelli, D. (1989). Evidence for edge and bar detectors in human vision. Vision Research, 29, 419-431. Kovesi, P. (2000). Phase congruency: A low-level image invariant. Psychological Research, 64, 136-148 Owens, R. A. (1994). Feature-free images. Pattern Recognition Letters, 15, 35-44. Tolhurst, D. J., & Dealy, R. S. (1975). The detection and identification of lines and edges. Vision Research, 15, 1367-1372. Tyler, C. W., Chan, H., Lei, L., McBride, B., & Kontsevich, L. L. (1992). Bit-stealing: how to get 1786 or more grey levels from an 8-bit color monitor. Proceedings SPIE, 1666, 351-364. Watson, A. B. (2000). Visual detection of spatial contrast patterns: Evaluation of five simple models. Optics Express, 6, 12-33. C1 C2 C3 C4 Phase-incongruent I1 I2 I3 I4


