Download

1 / 12
120 likes | 211 Vues
Learn methods, results, and lessons on estimating embodied emissions in the supply chain. Explore the approach of converting dollars to GHG emissions, utilizing tools like EIOLCA, and interpreting the significance of the results. Discover how to focus low-carbon purchasing efforts for a more sustainable future.

E N D
MAKING SUSTAINABILITY WORK Estimating Embodied Emissions in the Supply Chainmethods, results and lessons learned Presented by Kelly Hoell, Associate and Tracy Sagal, Associate Good Company 65 Centennial Loop, Suite B Eugene, Oregon 97401 www.goodcompany.com phone 541.341.4663 fax 541.341.6412
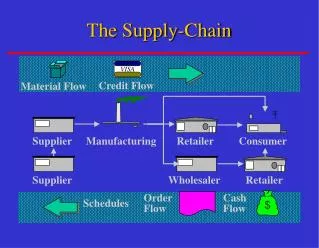
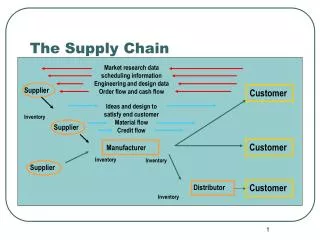
Overview • supply chain analysis: approach & tool • What do the results mean? How are they different from other emissions sources? • results and lessons learned • Leslie Kochan: Oregon DEQ • Discussion
approach: converting dollars to GHG Emissions • $ = expenditure • CO2e/$ = “carbon intensity” of expenditure • CO2e = final estimate of total emissions in expenditure
supply chain carbon: EIOLCA • powerful web-based, public-domain tool • carbon intensity database for different industries • use it to estimate supply chain GHG emissions • translates economic activity into GHG emissions • easy to use (especially compared to the alternative) • free to use • website: http://www.eiolca.net
supply chain carbon: EIOLCA • Economic Input-Output (EIO) = • model of the US economy • includes 428 economic sectors • based on 2002 data • Lifecycle Assessment (LCA) = • details from the academic literature on GHG emissions • looks at embodied emissions up to the point of purchase
Results: what do they mean? • Estimate • Rough, sense of scale, high level • Unlike other emissions sources • results can vary widely year-to-year • annual analysis won’t show “progress” towards goals • Supply chain is a big deal • often overlooked • deserves attention • Guidance on where to focus low-carbon purchasing efforts
Thank you Kelly Hoell, Associate 541.341.4663 x217 kelly.hoell@goodcompany.com Tracy Sagal, Associate 541.341.4663 x221 tracy.sagal@goodcompany.com