Download
1 / 30
300 likes | 1.23k Vues
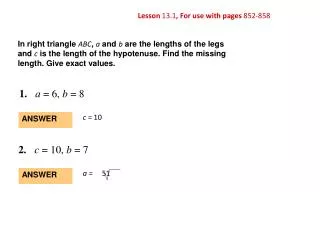
Lesson 4.2 , For use with pages 245-251. Find the product. 1. ( x + 6) ( x + 3) . x 2 + 9 x + 18. ANSWER. 2. ( x – 5) 2. x 2 – 10 x + 25. ANSWER. Lesson 4.2 , For use with pages 245-251. 3. 4( x + 5 ) ( x – 5). ANSWER. 4 x 2 – 100.

E N D
Lesson 4.2, For use with pages 245-251 Find the product 1. (x + 6) (x + 3) x2 + 9x + 18 ANSWER 2. (x – 5)2 x2 – 10x + 25 ANSWER
Lesson 4.2, For use with pages 245-251 3. 4(x + 5)( x – 5) ANSWER 4x2 – 100 4. A projectile, shot from the ground, reaches its highestpoint of 225 meters after 3.2 seconds. For how seconds is the projectile in the air? ANSWER 6.4 sec
+ k(vertex form) What do we know about the vertex form? • a= ????? ( +a opens up , -a opens down) • x – h = 0 x = h (axis of symmetry) • (h, k ) vertex
Identify the constants a = – 1/4h = – 2, and k = 5. Because a < 0, the parabola opens down. 14 EXAMPLE 1 Graph a quadratic function in vertex form Graphy= – (x + 2)2 + 5. SOLUTION STEP 1 STEP 2 Plot the vertex (h, k) = (– 2, 5) and draw the axis of symmetry x = – 2.
– – x = 0: y = (0 + 2)2 + 5 = 4 x = 2: y = (2 + 2)2 + 5 = 1 14 14 EXAMPLE 1 Graph a quadratic function in vertex form STEP 3 Evaluate the function for two values of x. Plot the points (0, 4) and (2, 1) and their reflections in the axis of symmetry. Draw a parabola through the plotted points. STEP 4
The Tacoma Narrows Bridge in Washington has two towers that each rise 307 feet above the roadway and are connected by suspension cables as shown. Each cable can be modeled by the function. 1 7000 y =(x – 1400)2 + 27 EXAMPLE 2 Use a quadratic model in vertex form Civil Engineering where xand yare measured in feet. What is the distance dbetween the two towers ?
EXAMPLE 2 Use a quadratic model in vertex form SOLUTION The vertex of the parabola is (1400, 27). So, a cable’s lowest point is 1400 feet from the left tower shown above. Because the heights of the two towers are the same, the symmetry of the parabola implies that the vertex is also 1400 feet from the right tower. So, the distance between the two towers is d = 2 (1400) = 2800 feet.
for Examples 1 and 2 GUIDED PRACTICE Graph the function. Label the vertex and axis of symmetry. 1. y = (x + 2)2– 3 SOLUTION Identify the constants a = 1 , h = – 2, and k = – 3. Because a > 0, the parabola opens up. STEP 1 STEP 2 Plot the vertex (h, k) = (– 2, – 3) and draw the axis of symmetry x = – 2.
for Examples 1 and 2 GUIDED PRACTICE STEP 3 Evaluate the function for two values of x. x = 0: y = (0 + 2)2 + – 3 = 1 x = 2: y = (2 + 2)2– 3 = 13 Plot the points (0, 4) and (2, 1) and their reflections in the axis of symmetry. Draw a parabola through the plotted points. STEP 4
for Examples 1 and 2 GUIDED PRACTICE 2. y = – (x + 1)2+ 5 SOLUTION Identify the constants a = 1 , h = – 2, and k = – 3. Because a < 0, the parabola opens down. STEP 1 STEP 2 Plot the vertex (h, k) = (– 1, 1) and draw the axis of symmetry x = – 1. STEP 3 Evaluate the function for two values of x. x = 0: y = – (0 + 2)2 + 5 = 4 x = 2: y = – (0 – 2)2 + 5 = 1 Plot the points (0, 4) and (2, 1) and their reflections in the axis of symmetry.
for Examples 1 and 2 GUIDED PRACTICE Draw a parabola through the plotted points. STEP 4
Identify the constants a = , h = – 3, and h = – 4. 12 52 12 12 12 x = 0: f(x)= (0 – 3)2–4 = – 3 2 x = 0: f(x)= (2 – 3)2–4 = for Examples 1 and 2 GUIDED PRACTICE 3. f (x) = (x – 3)2– 4 SOLUTION STEP 1 Because a > 0, the parabola opens up. STEP 2 Plot the vertex (h, k) = (– 3, – 4) and draw the axis of symmetry x = – 3. STEP 3 Evaluate the function for two values of x.
for Examples 1 and 2 GUIDED PRACTICE Plot the points (0, 4) and (2, 1) and their reflections in the axis of symmetry. Draw a parabola through the plotted points. STEP 4
1 6500 y = (x – 1400)2 + 27 for Examples 1 and 2 GUIDED PRACTICE 4. WHAT IF?Suppose an architect designs a bridge with cables that can be modeled by where x and y are measured in feet. Compare this function’s graph to the graph of the function in Example 2. SOLUTION This graph is slightly steeper than the graph in Example 2. They both have the same vertex and axis of symmetry, and both open up. Solution missing
x = = = – 1 p + q – 3 + 1 2 2 EXAMPLE 3 Graph a quadratic function in intercept form Graph y = 2(x + 3) (x – 1). SOLUTION STEP 1 Identify the x - intercepts. Because p = – 3 and q = 1, the x - intercepts occur at the points (– 3, 0) and (1, 0). STEP 2 Find the coordinates of the vertex. y = 2(– 1 + 3)(– 1 – 1) = – 8
EXAMPLE 3 Graph a quadratic function in intercept form STEP 3 Draw a parabola through the vertex and the points where the x - intercepts occur.
The path of a placekicked football can be modeled by the function y = – 0.026x(x – 46) where xis the horizontal distance (in yards) and yis the corresponding height (in yards). EXAMPLE 4 Use a quadratic function in intercept form Football a. How far is the football kicked ? b.What is the football’s maximum height ?
x = = = 23 p + q 0 + 46 y = –0.026(23)(23 –46) 13.8 2 2 EXAMPLE 4 Use a quadratic function in intercept form SOLUTION a.Rewrite the function as y = – 0.026(x – 0)(x – 46). Because p = 0 and q = 46, you know the x - intercepts are 0 and 46. So, you can conclude that the football is kicked a distance of46 yards. b.To find the football’s maximum height, calculate the coordinates of the vertex. The maximum height is the y-coordinate of the vertex, or about 13.8 yards.
p + q 3 + 1 x = = = – 5 2 2 for Examples 3 and 4 GUIDED PRACTICE Graph the function. Label the vertex, axis of symmetry, and x - intercepts. 5. y = (x – 3) (x – 7) SOLUTION STEP 1 Identify the x - intercepts. Because p = 3 and q = 7, the x - intercepts occur at the points (3, 0) and (7, 0). STEP 2 Find the coordinates of the vertex. y = (5 – 3) (5 – 1) = – 4 So the vertex is (5, – 4)
for Examples 3 and 4 GUIDED PRACTICE STEP 3 Draw a parabola through the vertex and the points where the x - intercepts occur.
4 + (–1) x = = = 3 2 3 2 3 2 3 2 2 25 2 25 2 y = 2( – 4) ( + 1) = – p + q 2 So the vertex is , for Examples 3 and 4 GUIDED PRACTICE 6. f (x) = 2(x – 4) (x + 1) SOLUTION STEP 1 Identify the x - intercepts. Because p = 4 and q = – 1, the x - intercepts occur at the points (4, 0) and (– 1, 0). STEP 2 Find the coordinates of the vertex.
for Examples 3 and 4 GUIDED PRACTICE STEP 3 Draw a parabola through the vertex and the points where the x - intercepts occur.
x = = = – 2 p + q – 1 + 5 2 2 for Examples 3 and 4 GUIDED PRACTICE 7. y = – (x + 1) (x – 5) SOLUTION STEP 1 Identify the x - intercepts. Because p = – 1 and q = 5, the x - intercepts occur at the points (– 1, 0) and (5, 0). STEP 2 Find the coordinates of the vertex. y = – (2 + 3)(2 – 1) = 9 So the vertex is (2, 9)
for Examples 3 and 4 GUIDED PRACTICE STEP 3 Draw a parabola through the vertex and the points where the x - intercepts occur.
p + q 0 + 50 y = 20.025(25)(25 –46) 15.625 2 2 x = = = 25 for Examples 3 and 4 GUIDED PRACTICE 8. WHAT IF?In Example 4, what is the maximum height of the football if the football’s path can be modeled by the function y = –0.025x(x – 50)? SOLUTION a.Rewrite the function as y = – 0.025(x – 0)(x – 50). Because p = 0 and q = 50, you know the x - intercepts are 0 and 50. So, you can conclude that the football is kicked a distance of50 yards. b.To find the football’s maximum height, calculate the coordinates of the vertex.
for Examples 3 and 4 GUIDED PRACTICE The maximum height is the y-coordinate of the vertex, or about 15.625 yards.