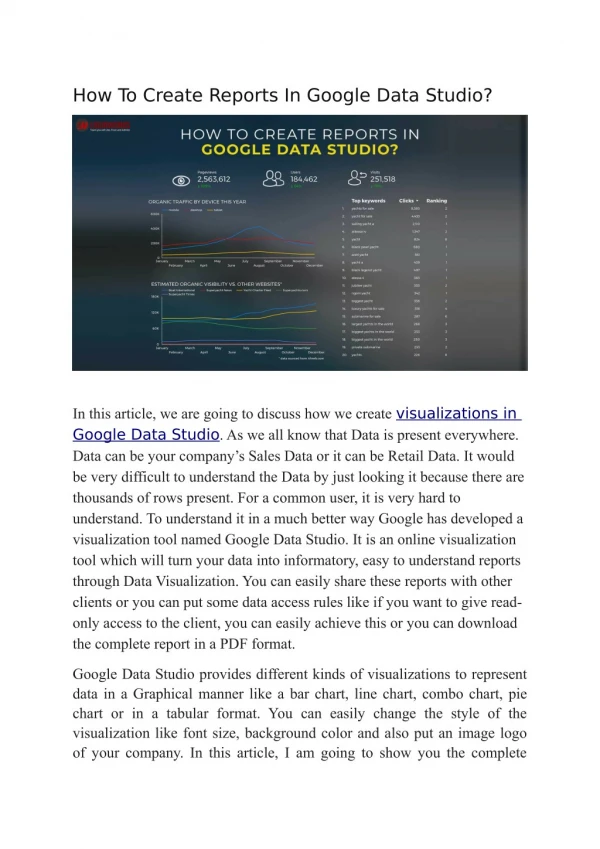
How to Visualize Data With Google Data Studio
<br><br><br><br>https://contentmarketinginstitute.com/2020/03/google-data-studio-visual-content/<br><br>Youu2019re familiar with Google Docs and Sheets, but have you used Google Data Studio?<br><br>The free tool lets you turn data into eye-catching visuals and easy-to-read reports.<br><br><br>

How to Visualize Data With Google Data Studio
E N D
Presentation Transcript
How to Visualize Data With Google Data Studio 82% of marketers struggle to identify and report analytics data Are you one of those who simply want to interpret your analytics visually? Have you ever heard of Google Data Studio? In this article, I’ll show you how to transform your data into engaging and interactive visual reports with Google Data Studio via the Content Marketing Institute. What do you think? What are your thoughts on Google Data Studio? Please leave your comments below. #visualization #googledatastudio #marketing #contentmarketing #Analytics #dashboard #digitalmarketing #marketing #content #cmo #DataStudio https://contentmarketinginstitute.com/2020/03/google-data-studio-visual-content/