Download
1 / 14
140 likes | 244 Vues
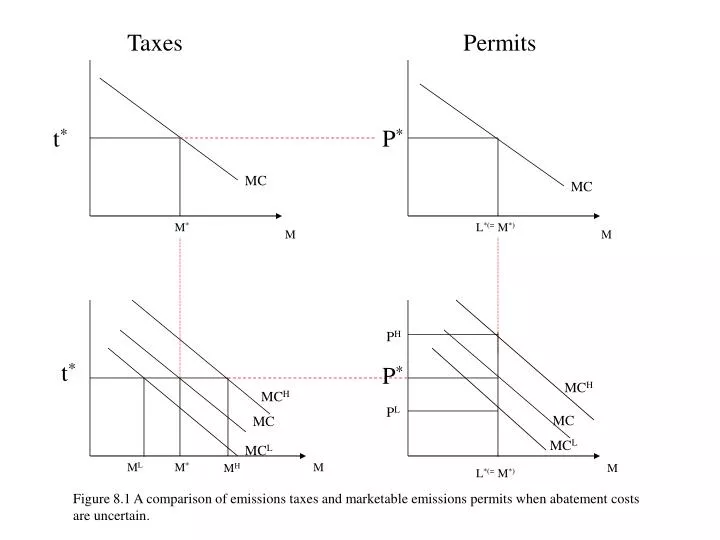
This analysis explores the comparative impacts of emissions taxes and market-based emissions permits under conditions of uncertain abatement costs. It examines the nuances of cost estimations, the varying incentive effects between policy instruments, and the implications of underestimating or overestimating costs on overall emissions management. Specific figures illustrate scenarios with perfect information, uncertainties regarding damage costs, and the economic consequences stemming from regulatory decisions. The findings highlight the importance of accurate cost assessments in effective environmental policy-making.

E N D
Taxes Permits t* P* MC MC M* L*(= M*) M M PH t* P* MCH MCH PL MC MC MCL MCL ML M* M MH M L*(= M*) Figure 8.1 A comparison of emissions taxes and marketable emissions permits when abatement costs are uncertain.
Figure 8.2 Target setting under perfect information. MD t* MC M* Emissions, M
Figure 8.3 Uncertainty about abatement costs – costs overestimated. MD Loss when licenses used tH t* MC (assumed) Loss when taxes used MC (true) Mt M* LH Emissions, M
Figure 8.4 Uncertainty about abatement costs – costs underestimated. MD t* tL MC (true) MC (assumed) LL M* Mt Emissions, M
Figure 8.5 Uncertainty about abatement costs – costs overestimated. MD MD tH t* MC (assumed) MC (true) Mt M* LH Emissions, M
Figure 8.6 Uncertainty about abatement costs – costs underestimated. MD MD t* tL MC (true) MC (assumed) M* LL Mt Emissions, M
Figure 8.7 Uncertainty about damage costs – damages underestimated. MD (true) MD (estimated) t MC (true) M* L Emissions, M
Figure 8.8 Consequences of a threshold in the damages function. Total damages D M Emissions, M
Figure 8.8 (Panel (b)) Marginal damages & marginal (abatement) costs MD t2 MC1 t1 MC2 M M22 M1 M2 Emissions, M
Figure 8.9(a) Incentive effects with permit systems. MD P1 * MC (reported) P2 MC (true) M* =L* MP =LP Emissions, M
Figure 8.9(b) Incentive effects with an emissions tax. MD * T MC (true) MC (reported) MT1 MT2 M* Emissions, M
Figure 8.10(a) An incentive compatible instrument and under-reporting costs. MD P* MC (true) MC (reported) M*= L* Emissions, M
Figure 8.10(b) An incentive compatible instrument and over-reporting costs. MD MC (reported) P* MC (true) M* Emissions, M
Figure 8.11 The net benefits of regulation. Marginal real resource cost of abatement + induced indirect costs + transactions costs Marginal real resource cost of abatement + induced indirect costs D Marginal real resource cost of abatement C Gross marginal benefits of abatement B A ZB ZA ZC Emissions abatement