SCIA Limb Reflectance vs. Model P Liebing, IUP Bremen SCIA Data
140 likes | 157 Vues
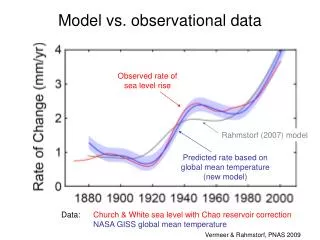
This study compares limb reflectance data from SCIA with the model P Liebing, IUP Bremen SCIA Data. The analysis examines the relationship between reflectance values and various atmospheric conditions such as aerosol and cloud coverage. The results show differences between the data and the model, highlighting the limitations of the model in accurately representing all wavelengths and heights.

SCIA Limb Reflectance vs. Model P Liebing, IUP Bremen SCIA Data
E N D
Presentation Transcript
SCIA Limb Reflectance vs. Model P. Liebing, IUP Bremen
SCIA Data • 9 Limb states over ocean with • Cut on ratio of color index = (I(1090 nm)/I(750 nm)) between successive tangent heights (similar, but stricter than SCODA used for limb cloud flagging) • SACURA plots with low reflectance and OD (visually)
Outline • Initially: • Investigate whether it is possible to check the limb reflectance with a RTM • Update as of 09/2009: • More thorough model comparison w/respect to some features
SCIATRAN Settings (Initial Check) • Standard settings: • Standard WMO aerosol profile (maritime+background) • BRDF with sun glint, no white caps • Absorber profiles from Mc Linden climatology; p,T US Std. • Variations: • Note: acc. to SCODA, clouds, aerosol should be low
Spectral Windows (Initial Check) • 16 windows as far as possible outside strong absorption structures • 360-390, 405-450, 540-560, 640-650, 670-680, 740-750, 775-790, 805-808, 840-850, 857-863, 870-885, 990-1000, 1085-1100, 1225-1240, 1300-1315, 1540-1560 nm • Data calculated/averaged in steps of 1,2 or 5 nm (dep. on window) • SCIA Data: • Full calibration (including polarization and M-factors) with scial1c • Only one profile (0) • SCIATRAN: • Reflectance normalized to
Results: Reflectance • Example: Orbit 7022, TH=29 km • Reflectance:
Results: Difference to SCIATRAN • Example: Orbit 7022, TH=29 km • Example: Orbit 22911, TH=29 km • Example: Orbit 22911, TH=38 km
(Initial Check) In a Nut Shell: • Relative differences vs. SCIA reflectance, tangent height and wavelength • Each point represents one state • Differences between data and SCIATRAN • Within ±15% at smallest (360 nm) • Increasing with wavelength • No systematic behavior with TH • States are not consistently good or bad at all wave-lengths and TH Standard Set Albedo=0.1
(Initial Check) Observations • Sensitivity to aerosol/albedo (clouds) increases with wavelength • For <400 nm, variation between states is sometimes larger than variation between SCIATRAN sets • Classification of states by color index + SACURA is not sufficient to select states with similar atmospheric conditions • No single SCIATRAN set is able to describe all wavelengths/ heights within one state • There may be a height dependent combination of aerosol/cloud parameters that fits the data • Normally, fits to radiance/reflectance are used to retrieve those parameters • Atmospheric state needs to be known to tune data to model ->loop • Note: Model limitations, e.g., spherical homogeneity, limited aerosol representation etc.
(Update) More SCIATRAN Settings and wavelengths • ~100 Wavelengths over PMD 1-5 bandwidth, TH<=51 km, more aerosol/albedo settings (~50) Orbit 33750, State 15 PMD1 (ch#1/2) Calibration offset in ch #1, visible at large TH TH=51 km TH=21 km TH 28 km TH=41 km TH=38 km TH=44 km TH=47 km
Slope and Offsets? Offsets at large solar zenith angle, even though no sensitivity to troposphere TH~35 km Different slopes in different PMD bands (or -depen-dent offset?) State 25 0=37º State 15 0=52º State 11 0=78º Seems to become smaller w/smaller 0 Is it the model or the data?
Relative Deviations SCIATRAN-DATA • Different states in orbit (537 nm) = different scat. geometries + atmosph. Conditions (Aerosol profiles differ below 30 km): • Size of rel. diff. (and offset) depends on state and wavelength • Turnover between 30-40 km = persistent feature: SCIATRAN (modulo offset at 30 km) decreases relative to data w/increasing TH • Effect of spatial stray light or model shortcomings? • Would rather expect constant R/R for TH>=30 km if due to model State 20 State 15 State 13 State 22 ? State 25 State 30
Conclusions • SCIATRAN and Limb data agree within few % in some instances (particular state, wavelength and TH) • Up to 50%+ variation with state, wavelength and TH • Impossible to determine the state, wavelength and TH for which atmospheric state corresponds to that modeled in SCIATRAN • Model comparison in general unsuitable to verify data calibration with higher accuracy than observed variations unless atmospheric state is known • In particular aerosol profile and • cloud coverage in a wide region (~1000 km) around geolocation of state • Nevertheless, it may still be possible to observe particular features: • Offset in ch. 1 effect in data • Persistent offsets with wavelength dependent slopes at large solar zenith angles effect in data or model • Increase in the data w.r.t. to model at all wavelengths/geometries for TH >~35 km effect in data or model
Calibration between Wavelengths? • Color index ratio C=I(=1090 nm)/I(=749 nm) sensitive to clouds and aerosol • Single Rayleigh scattering C 0.2 • Should be approached at large TH if low/no aerosol • Variation at large TH larger in data than in SCIATRAN