Model Overview
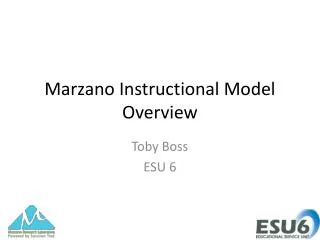
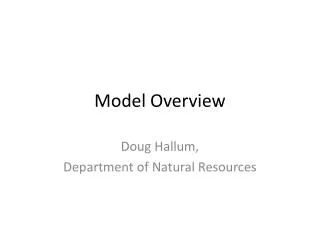
Model Overview. Doug Hallum, Department of Natural Resources. Atmosphere. P. Land. Surface. ΔSTO. Aquifer. ΔSTO. ET. SWI. SWO. GWI. GWO. P. Watershed Model (CROPSIM). SWI. Surface Water Model (STELLA) . R. Δ STO*. R. Groundwater Model (MODFLOW) . Δ STO*.

Model Overview
E N D
Presentation Transcript
Model Overview Doug Hallum, Department of Natural Resources
Atmosphere P Land Surface ΔSTO Aquifer ΔSTO ET SWI SWO GWI GWO
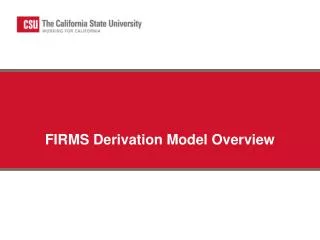
P Watershed Model (CROPSIM) SWI Surface Water Model (STELLA) R Δ STO* R Groundwater Model (MODFLOW) Δ STO* Water budget fluxes with asterisk can be compared to data-derived calibration targets ET* RO* RO* SWO* Q BF* GWI* GWO*
COHYST Acreage Data Sets Doug Hallum, Department of Natural Resources
COHYST Acreage Data Sets • Documentation • Potential issues – Sponsor discussions • Sponsor directions • Current effort • Major decisions
Documentation COHYST Simulated Historical Land Use Distribution: 1950-2005 Introduction Simulating the historical distribution of land use patterns from 1950 to 2005 was a sophisticated process involving many inputs and numerous processing and formatting steps. The challenges were to create an annually variable dataset starting with a land use inventory from the University of Nebraska, Lincoln Center for Advanced Land Management Information Technologies (CALMIT), as well as the USDA Agricultural Census inventory, and assign the annual values to each active 160 acre model grid cell in the COHYST area. Values for twenty seven different land uses were estimated using remote sensing technology and manual reporting, respectively. These data were classified as groundwater irrigated, surface water irrigated and non-irrigated for the purpose of generating model inputs.
Potential issues: Sponsor discussion • Section - temporal artifacts recognized • Township - artifacts propagated • County - artifacts perceptible • NRD - artifacts perceptible
Current Effort • Use Certified acres/Available data • Draft process • Spatial view • Fundamental Questions
Questions • What means should we use to define/distribute dryland agriculture? • Do we need to accomplish a parcel-by-parcel land use assignment? • How is spatial dataset developed for TBNRD? • What about other NRDs?