Projections of the IT and Engineering Workforce in the U.S. (2002-2012)
This presentation by John Sargent, Senior Policy Advisor at the U.S. Department of Commerce, explores the adequacy of the U.S. science and engineering workforce from 2002 to 2012, with similar data for 2004-2014. It offers insights into the current and future demand for IT, science, and engineering professionals, including statistics on job openings and occupational distribution. The report emphasizes the importance of understanding workforce projections and the potential impact of the "brain drain" in technology sectors. For further information, visit the provided links.

Projections of the IT and Engineering Workforce in the U.S. (2002-2012)
E N D
Presentation Transcript
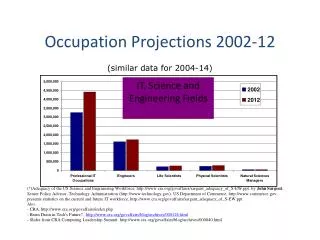
Occupation Projections 2002-12 (similar data for 2004-14) IT, Science and Engineering Fields (*)Adequacy of the US Science and Engineering Workforce, http://www.cra.org/govaffairs/sargent_adequacy_of_S-EW.ppt, by John Sargent, Senior Policy Advisor, Technology Administration (http://www.technology.gov), US Department of Commerce, http://www.commerce.gov, presents statistics on the current and future IT workforce, http://www.cra.org/govaffairs/sargent_adequacy_of_S-EW.ppt Also, - CRA, http://www.cra.org/govaffairs/index.php- Brain Drain in Tech's Future?, http://www.cra.org/govaffairs/blog/archives/000126.html- Slides from CRA Computing Leadership Summit http://www.cra.org/govaffairs/blog/archives/000040.html
Supply & Demand (similar values for 2004-14) Error in projections is of the order of 10%
Occupational Distribution Projected S&E Job Openings(new jobs plus net replacements)2002-2012* 70% (*) for source details – see previous slide