Download
1 / 26
260 likes | 386 Vues
Simple, Fast and Accurate Solvent-free Method for Produced Water Process Monitoring. What is produced water?. Water that comes to the surface with oil and gas Contains many chemical constituents – Salt content (salinity, total dissolved solids, electrical conductivity) – Oil and grease

E N D
Simple, Fast and Accurate Solvent-free Method for Produced Water Process Monitoring
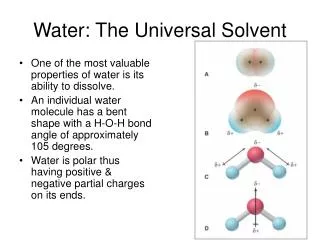
What is produced water? Water that comes to the surface with oil and gas • Contains many chemical constituents – Salt content (salinity, total dissolved solids, electrical conductivity) – Oil and grease • Composite of many hydrocarbons and other organic materials – Toxics from various natural inorganic and organic compounds or chemical additives – NORM – Some oxygen demanding materials
U.S • Oil and grease limit used as a “surrogate” for other pollutants – When oil and grease are controlled, other pollutants will also be controlled • Limit is based on a statistical analysis of data from 60 U.S. platforms – Monthly average = 95th percentile = 29 mg/l – Daily maximum = 99th percentile = 42 mg/l Limits based on the Freon Extraction method
Method comparison • Old protocol • IR Technique • Freon extraction – kept light ends D
Method comparison • New Technique – EPA 1664 • Hexane extraction • Distill off the hexane • Loss of light ends • Weigh the residue Hexane
A2 Test Methodology • Filter water through a PTFE filter • Mass loading • Highly efficient • Even distribution • Quick drying
D Filter Method • Analysis time– 30 seconds • No solvents • Easy disposal • Easy cleanup
1. Place Sample on window 2. Rotate TumblIR into place 3. Analyze the sample 4. Cleaning is easy! No Sample Prep Required, No Training Required
Why FT-IR for Lubrication Analysis? Water Additive depletion Antioxidant Phenolic Aminic EP/AW Oxidation Nitration Varnish formation
Water in oil Scatter IR Detector IR Detector B Small droplets => IR absorbed A Large droplets => IR scattered Before surfactant Before surfactant
B A Surfactant effect Before • Minimizes transfer loss from container to container • Ensures consistency in amount of oil measured After
0.7 0.6 0.5 0.4 Absorbance 0.3 0.2 0.7 0.6 0.1 0.5 0.0 0.4 Absorbance 0.3 0.2 0.1 0.0 1500 1480 1460 1440 1420 1400 1380 1360 1340 Surfactant Effect Before surfactant After surfactant
Gravimetrically Prepared Oil in Water Standards Used for FT-IR Calibration and Method Development • Oil dilution standards gravimetrically prepared in IPA • Appropriate volumes added to a thoroughly cleaned 1000mL volumetric flask • The IPA solvent is evaporated at 50°C under vacuum • Dried flask is filled to the mark with distilled water • 250uL of Oil Stabilizer additive is added • Sample is vigorously shaken by inversion for 1-2min • Transfer solution to cleaned 1L sample jar, shaking the flask vigorously after ¾ of the solution is transferred
1.4 2925.8 1.2 1.0 0.8 2856.0 2958.1 Absorbance 0.6 0.4 1461.9 0.2 1377.6 722.5 0.0 3800 3600 3400 3200 3000 2800 2600 2400 2200 2000 1800 1600 1400 1200 1000 800 600 Wavenumber FT-IR Spectrum of Mineral Oil
2.8 2.6 2.4 2.2 2.0 1.8 1.6 1.4 Absorbance 1.2 1.0 0.8 0.6 0.4 0.2 0.0 1750 1700 1650 1600 1550 1500 1450 1400 1350 Wavenumber
Predicted Concentration Actual Concentration R2=0.9957
Predicted Concentration Actual Concentration R2=0.9957
2.8 2.6 1463.2 2.4 2.2 2.0 1.8 1.6 Absorbance 1.4 1377.4 1.2 1.0 0.8 0.6 0.4 1520 1500 1480 1460 1440 1420 1400 1380 1360 1340 1320 Wavenumber
Additional capabilities • Water in crude oil • 0.1 – 0.3% level • Keeps pipes from corroding • Water in crude oil • 1% – 50% • Allows dewatering/production validation etc • Water/Glycol mix analysis • Drilling fluid