Download
1 / 38
380 likes | 464 Vues
Explore the energy dependence of "Underlying Event" phenomena in particle collisions at various energies from Tevatron to LHC, featuring CDF and CMS data comparisons with PYTHIA simulations. Detailed analysis of charged particle densities and PT sums in different regions.

E N D
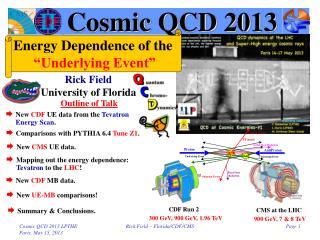
Cosmic QCD 2013 Energy Dependence of the “Underlying Event” Rick Field University of Florida Outline of Talk • New CDF UE data from the Tevatron Energy Scan. • Comparisons with PYTHIA 6.4 Tune Z1. • New CMS UE data. • Mapping out the energy dependence: Tevatron to the LHC! • New CDF MB data. • New UE-MB comparisons! CDF Run 2 CMS at the LHC • Summary & Conclusions. 300 GeV, 900 GeV, 1.96 TeV 900 GeV, 7 & 8 TeV Rick Field – Florida/CDF/CMS
Tevatron Energy Scan • Just before the shutdown of the Tevatron CDF has collected more than 10M “min-bias” events at several center-of-mass energies! 900 GeV 300 GeV 1.96 TeV 300 GeV 12.1M MB Events 900 GeV 54.3M MB Events Rick Field – Florida/CDF/CMS
UE Observables • “Transverse” Charged Particle Density: Number of charged particles (pT > 0.5 GeV/c, |h| < hcut) in the “transverse” region as defined by the leading charged particle, PTmax, divided by the area in h-f space, 2hcut×2p/3, averaged over all events with at least one particle with pT > 0.5 GeV/c, |h| < hcut. • “Transverse” Charged PTsum Density: Scalar pT sum of the charged particles (pT > 0.5 GeV/c, |h| < hcut) in the “transverse” region as defined by the leading charged particle, PTmax, divided by the area in h-f space, 2hcut×2p/3, averaged over all events with at least one particle with pT > 0.5 GeV/c, |h| < hcut. • “Transverse” Charged Particle Average PT: Event-by-event <pT> = PTsum/Nchg for charged particles (pT > 0.5 GeV/c, |h| < hcut) in the “transverse” region as defined by the leading charged particle, PTmax, averaged over all events with at least one particle in the “transverse” region with pT > 0.5 GeV/c, |h| < hcut. • Zero “Transverse” Charged Particles: If there are no charged particles in the “transverse” region then Nchg and PTsum are zero and one includes these zeros in the average over all events with at least one particle with pT > 0.5 GeV/c, |h| < hcut. However, if there are no charged particles in the “transverse” region then the event is not used in constructing the “transverse” average pT. hcut = 1.0 and hcut = 0.8 Rick Field – Florida/CDF/CMS
UE Observables • “Toward” Charged Particle Density: Number of charged particles (pT > 0.5 GeV/c, |h| < 0.8) in the “toward” region (not including PTmax) as defined by the leading charged particle, PTmax, divided by the area in h-f space, 2hcut×2p/3, averaged over all events with at least one particle with pT > 0.5 GeV/c, |h| < hcut. • “Toward” Charged PTsum Density: Scalar pT sum of the charged particles (pT > 0.5 GeV/c, |h| < 0.8) in the “toward” region (not including PTmax) as defined by the leading charged particle, PTmax, divided by the area in h-f space, 2hcut×2p/3, averaged over all events with at least one particle with pT > 0.5 GeV/c, |h| < hcut. • “Away” Charged Particle Density: Number of charged particles (pT > 0.5 GeV/c, |h| < 0.8) in the “away” region as defined by the leading charged particle, PTmax, divided by the area in h-f space, 2hcut×2p/3, averaged over all events with at least one particle with pT > 0.5 GeV/c, |h| < hcut. • “Away” Charged PTsum Density: Scalar pT sum of the charged particles (pT > 0.5 GeV/c, |h| < 0.8) in the “away” region as defined by the leading charged particle, PTmax, divided by the area in h-f space, 2hcut×2p/3, averaged over all events with at least one particle with pT > 0.5 GeV/c, |h| < hcut. hcut = 0.8 Rick Field – Florida/CDF/CMS
UE Observables • Overall “Associated” Charged Particle Density: Number of charged particles (pT > 0.5 GeV/c, |h| < 0.8, not including PTmax) as defined by the leading charged particle, PTmax, divided by the area in h-f space, 2hcut×2p, averaged over all events with at least one particle with pT > 0.5 GeV/c, |h| < hcut. • Overall “Associated” Charged PTsum Density: Scalar pT sum of the charged particles (pT > 0.5 GeV/c, |h| < 0.8, not including PTmax) as defined by the leading charged particle, PTmax, divided by the area in h-f space, 2hcut×2p, averaged over all events with at least one particle with pT > 0.5 GeV/c, |h| < hcut. Note: The overall “associated” density is equal to the average of the “Towards”, “Away”, and “Transverse” densities. Overall “Associated” Density = (“Towards” Density + “Away” Density + “Transverse” Density)/3 hcut = 0.8 Rick Field – Florida/CDF/CMS
UE Observables • “transMAX” and “transMIN” Charged Particle Density: Number of charged particles (pT > 0.5 GeV/c, |h| < 0.8) in the the maximum (minimum) of the two “transverse” regions as defined by the leading charged particle, PTmax, divided by the area in h-f space, 2hcut×2p/6, averaged over all events with at least one particle with pT > 0.5 GeV/c, |h| < hcut. • “transMAX” and “transMIN” Charged PTsum Density: Scalar pT sum of charged particles (pT > 0.5 GeV/c, |h| < 0.8) in the the maximum (minimum) of the two “transverse” regions as defined by the leading charged particle, PTmax, divided by the area in h-f space, 2hcut×2p/6, averaged over all events with at least one particle with pT > 0.5 GeV/c, |h| < hcut. Note: The overall “transverse” density is equal to the average of the “transMAX” and “TransMIN” densities. The “TransDIF” Density is the “transMAX” Density minus the “transMIN” Density “Transverse” Density = “transAVE” Density = (“transMAX” Density + “transMIN” Density)/2 “TransDIF” Density = “transMAX” Density - “transMIN” Density hcut = 0.8 Rick Field – Florida/CDF/CMS
“transMIN” & “transDIF” Question: Do you expect the energy dependence of the “transMIN” and “transDIF” densities to be the same? Or do you expect that one of the two densities will increase faster with increasing energy than the other? Which one and why? • The “toward” region contains the leading “jet”, while the “away” region, on the average, contains the “away-side” “jet”. The “transverse” region is perpendicular to the plane of the hard 2-to-2 scattering and is very sensitive to the “underlying event”. For events with large initial or final-state radiation the “transMAX” region defined contains the third jet while both the “transMAX” and “transMIN” regions receive contributions from the MPI and beam-beam remnants. Thus, the “transMIN” region is very sensitive to the multiple parton interactions (MPI) and beam-beam remnants (BBR), while the “transMAX” minus the “transMIN” (i.e. “transDIF”) is very sensitive to initial-state radiation (ISR) and final-state radiation (FSR). “TransMIN” density more sensitive to MPI & BBR. “TransDIF” density more sensitive to ISR & FSR. 0 ≤ “TransDIF” ≤ 2×”TransAVE” “TransDIF” = “TransAVE” if “TransMIX” = 3×”TransMIN” Rick Field – Florida/CDF/CMS
Overall “Associated” Density • Corrected CDF data at 1.96 TeV, 900 GeV, and 300 GeV on the overall “associated” charged particle and charged PTsum density as defined by the leading charged particle (PTmax) for charged particles with pT > 0.5 GeV/c and |h| < 0.8. The data are corrected to the particle level with errors that include both the statistical error and the systematic uncertainty. The data are compared with PYTHIA Tune Z1. Rick Field – Florida/CDF/CMS
Overall “Associated” Density • Corrected CDF data at 1.96 TeV, 900 GeV, and 300 GeV on the overall “associated” charged particle and charged PTsum density as defined by the leading charged particle (PTmax) for charged particles with pT > 0.5 GeV/c and |h| < 0.8. The data are corrected to the particle level with errors that include both the statistical error and the systematic uncertainty. The data are compared with PYTHIA Tune Z1. Rick Field – Florida/CDF/CMS
“Associated” Charged Particle Density • Corrected CDF data at 1.96 TeV, 900 GeV, and 300 GeV on the “associated” charged particle density in the “toward”, “away”, and “transverse” regions as defined by the leading charged particle (PTmax) for charged particles with pT > 0.5 GeV/c and |h| < 0.8. The data are corrected to the particle level with errors that include both the statistical error and the systematic uncertainty. The data are compared with PYTHIA Tune Z1. Rick Field – Florida/CDF/CMS
“Associated” Charged Particle Density • Corrected CDF data at 1.96 TeV, 900 GeV, and 300 GeV on the “associated” charged particle density in the “toward”, “away”, and “transverse” regions as defined by the leading charged particle (PTmax) for charged particles with pT > 0.5 GeV/c and |h| < 0.8. The data are corrected to the particle level with errors that include both the statistical error and the systematic uncertainty. The data are compared with PYTHIA Tune Z1. Rick Field – Florida/CDF/CMS
“Associated” Charged PTsum Density • Corrected CDF data at 1.96 TeV, 900 GeV, and 300 GeV on the “associated” charged PTsum density in the “toward”, “away”, and “transverse” regions as defined by the leading charged particle (PTmax) for charged particles with pT > 0.5 GeV/c and |h| < 0.8. The data are corrected to the particle level with errors that include both the statistical error and the systematic uncertainty. The data are compared with PYTHIA Tune Z1. Rick Field – Florida/CDF/CMS
“Toward” Associated Density • At low center-of-mass energies PTmax carries almost all the momentum of the “toward” parton (i.e. z ≈ 1) leaving very little momentum for the other particles in the “jet”. 300 GeV “Away” Parton “Toward” Parton “PTmax” Particle “Away” Particles “Associated” Toward Particles Rick Field – Florida/CDF/CMS
“Toward” Associated Density • At higher center-of-mass energies the same PTmax carries less of the momentum of the “toward” parton (i.e. z < 1) leaving more momentum for the other particles in the “jet”. 1.96 TeV “Away” Parton “Toward” Parton “PTmax” Particle “Away” Particles “Associated” Toward Particles Rick Field – Florida/CDF/CMS
“Associated” Charged PTsum Density • Corrected CDF data at 1.96 TeV, 900 GeV, and 300 GeV on the “associated” charged PTsum density in the “toward”, “away”, and “transverse” regions as defined by the leading charged particle (PTmax) for charged particles with pT > 0.5 GeV/c and |h| < 0.8. The data are corrected to the particle level with errors that include both the statistical error and the systematic uncertainty. The data are compared with PYTHIA Tune Z1. Rick Field – Florida/CDF/CMS
“transMAX/MIN” NchgDen • Corrected CDF data at 1.96 TeV, 900 GeV, and 300 GeV on the charged particle density in the “transMAX” and “transMIN” regions as defined by the leading charged particle (PTmax) for charged particles with pT > 0.5 GeV/c and |h| < 0.8. The data are corrected to the particle level with errors that include both the statistical error and the systematic uncertainty. The data are compared with PYTHIA Tune Z1. Rick Field – Florida/CDF/CMS
“transDIF/AVE” NchgDen • Corrected CDF data at 1.96 TeV, 900 GeV, and 300 GeV on the charged particle density in the “transAVE” and “transDIF”regions as defined by the leading charged particle (PTmax) for charged particles with pT > 0.5 GeV/c and |h| < 0.8. The data are corrected to the particle level with errors that include both the statistical error and the systematic uncertainty. The data are compared with PYTHIA Tune Z1. Rick Field – Florida/CDF/CMS
“transMAX/MIN” NchgDen • Corrected CDF data at 1.96 TeV, 900 GeV, and 300 GeV on the charged particle density in the “transMAX”, “transMIN”, and “transDIF” regions as defined by the leading charged particle (PTmax) for charged particles with pT > 0.5 GeV/c and |h| < 0.8. The data are corrected to the particle level with errors that include both the statistical error and the systematic uncertainty. The data are compared with PYTHIA Tune Z1. Rick Field – Florida/CDF/CMS
“transMAX/MIN” PTsumDen • Corrected CDF data at 1.96 TeV, 900 GeV, and 300 GeV on the charged PTsum density in the “transMAX” and “transMIN” regions as defined by the leading charged particle (PTmax) for charged particles with pT > 0.5 GeV/c and |h| < 0.8. The data are corrected to the particle level with errors that include both the statistical error and the systematic uncertainty. The data are compared with PYTHIA Tune Z1. Rick Field – Florida/CDF/CMS
“transDIF/AVE” PTsumDen • Corrected CDF data at 1.96 TeV, 900 GeV, and 300 GeV on the charged PTsum density in the “transAVE” and “transDIF” regions as defined by the leading charged particle (PTmax) for charged particles with pT > 0.5 GeV/c and |h| < 0.8. The data are corrected to the particle level with errors that include both the statistical error and the systematic uncertainty. The data are compared with PYTHIA Tune Z1. Rick Field – Florida/CDF/CMS
“transMAX/MIN” PTsumDen • Corrected CDF data at 1.96 TeV, 900 GeV, and 300 GeV on the charged PTsum density in the “transMAX”, “transMIN”, and “transDIF” regions as defined by the leading charged particle (PTmax) for charged particles with pT > 0.5 GeV/c and |h| < 0.8. The data are corrected to the particle level with errors that include both the statistical error and the systematic uncertainty. The data are compared with PYTHIA Tune Z1. Rick Field – Florida/CDF/CMS
“transMAX” NchgDen vs Ecm • Corrected CDF data at 1.96 TeV, 900 GeV, and 300 GeV on the charged particle density in the “transMAX” region as defined by the leading charged particle (PTmax) for charged particles with pT > 0.5 GeV/c and |h| < 0.8. The data are corrected to the particle level with errors that include both the statistical error and the systematic uncertainty. • Corrected CDF data on the charged particle density in the “transMAX” region as defined by the leading charged particle (PTmax) for charged particles with pT > 0.5 GeV/c and |h| < 0.8 with 5 < PTmax < 6 GeV/c. The data are plotted versus the center-of-mass energy (log scale). Rick Field – Florida/CDF/CMS
“transMIN” NchgDen vs Ecm • Corrected CDF data at 1.96 TeV, 900 GeV, and 300 GeV on the charged particle density in the “transMIN” region as defined by the leading charged particle (PTmax) for charged particles with pT > 0.5 GeV/c and |h| < 0.8. The data are corrected to the particle level with errors that include both the statistical error and the systematic uncertainty. • Corrected CDF data on the charged particle density in the “transMIN” region as defined by the leading charged particle (PTmax) for charged particles with pT > 0.5 GeV/c and |h| < 0.8 with 5 < PTmax < 6 GeV/c. The data are plotted versus the center-of-mass energy (log scale). Rick Field – Florida/CDF/CMS
“transDIF” NchgDen vs Ecm • Corrected CDF data at 1.96 TeV, 900 GeV, and 300 GeV on the charged particle density in the “transDIF” region as defined by the leading charged particle (PTmax) for charged particles with pT > 0.5 GeV/c and |h| < 0.8. The data are corrected to the particle level with errors that include both the statistical error and the systematic uncertainty. • Corrected CDF data on the charged particle density in the “transDIF” region as defined by the leading charged particle (PTmax) for charged particles with pT > 0.5 GeV/c and |h| < 0.8 with 5 < PTmax < 6 GeV/c. The data are plotted versus the center-of-mass energy (log scale). Rick Field – Florida/CDF/CMS
“Transverse” NchgDen vs Ecm • Corrected CDF data at 1.96 TeV, 900 GeV, and 300 GeV on the charged particle density in the “transMAX”, “transMIN”, “transAVE”, and “transDIF” regions as defined by the leading charged particle (PTmax) for charged particles with pT > 0.5 GeV/c and |h| < 0.8 with 5 < PTmax < 6 GeV/c. The data are plotted versus the center-of-mass energy (log scale). • Ratio of CDF data at 1.96 TeV, 900 GeV, and 300 GeVto the value at 300 GeV for the charged particle density in the “transMAX”, “transMIN”, “transAVE”, and “transDIF” regions as defined by the leading charged particle (PTmax) for charged particles with pT > 0.5 GeV/c and |h| < 0.8 with 5 < PTmax < 6 GeV/c. The data are plotted versus the center-of-mass energy (log scale). Rick Field – Florida/CDF/CMS
“Transverse” PTsumDen vs Ecm • Corrected CDF data at 1.96 TeV, 900 GeV, and 300 GeV on the charged PTsum density in the “transMAX”, “transMIN”, “transAVE”, and “transDIF” regions as defined by the leading charged particle (PTmax) for charged particles with pT > 0.5 GeV/c and |h| < 0.8 with 5 < PTmax < 6 GeV/c. The data are plotted versus the center-of-mass energy (log scale). • Ratio of CDF data at 1.96 TeV, 900 GeV, and 300 GeVto the value at 300 GeV for the charged PTsum density in the “transMAX”, “transMIN”, “transAVE”, and “transDIF” regions as defined by the leading charged particle (PTmax) for charged particles with pT > 0.5 GeV/c and |h| < 0.8 with 5 < PTmax < 6 GeV/c. The data are plotted versus the center-of-mass energy (log scale). Rick Field – Florida/CDF/CMS
“TransMAX/MIN” vs Ecm • Corrected CDF data at 1.96 TeV, 900 GeV, and 300 GeV on the charged PTsum density in the “transMAX”, and the “transMIN”, regions as defined by the leading charged particle (PTmax) for charged particles with pT > 0.5 GeV/c and |h| < 0.8 with 5 < PTmax < 6 GeV/c. The data are plotted versus the center-of-mass energy (log scale). The data are compared with PYTHIA 6.4 Tune Z1. • Corrected CDF data at 1.96 TeV, 900 GeV, and 300 GeV on the charged particle density in the “transMAX”, and the “transMIN”, regions as defined by the leading charged particle (PTmax) for charged particles with pT > 0.5 GeV/c and |h| < 0.8 with 5 < PTmax < 6 GeV/c. The data are plotted versus the center-of-mass energy (log scale). The data are compared with PYTHIA 6.4 Tune Z1. Rick Field – Florida/CDF/CMS
“TransDIF/AVE” vs Ecm • Corrected CDF data at 1.96 TeV, 900 GeV, and 300 GeV on the charged PTsum density in the “transAVE”, and the “transDIF”, regions as defined by the leading charged particle (PTmax) for charged particles with pT > 0.5 GeV/c and |h| < 0.8 with 5 < PTmax < 6 GeV/c. The data are plotted versus the center-of-mass energy (log scale). The data are compared with PYTHIA 6.4 Tune Z1. • Corrected CDF data at 1.96 TeV, 900 GeV, and 300 GeV on the charged particle density in the “transAVE”, and the “transDIF”, regions as defined by the leading charged particle (PTmax) for charged particles with pT > 0.5 GeV/c and |h| < 0.8 with 5 < PTmax < 6 GeV/c. The data are plotted versus the center-of-mass energy (log scale). The data are compared with PYTHIA 6.4 Tune Z1. Rick Field – Florida/CDF/CMS
“TransMIN/DIF” vs Ecm Answer to Question The “transMIN” (MPI-BBR component) increases much faster with center-of-mass energy than the “transDIF” (ISR-FSR component)! Duh!! • Ratio of CDF data at 1.96 TeV, 900 GeV, and 300 GeVto the value at 300 GeV for the charged PTsum density in the “transMIN”, and “transDIF” regions as defined by the leading charged particle (PTmax) for charged particles with pT > 0.5 GeV/c and |h| < 0.8 with 5 < PTmax < 6 GeV/c. The data are plotted versus the center-of-mass energy (log scale). The data are compared with PYTHIA 6.4 Tune Z1. • Ratio of CDF data at 1.96 TeV, 900 GeV, and 300 GeVto the value at 300 GeV for the charged particle density in the “transMIN”, and “transDIF” regions as defined by the leading charged particle (PTmax) for charged particles with pT > 0.5 GeV/c and |h| < 0.8 with 5 < PTmax < 6 GeV/c. The data are plotted versus the center-of-mass energy (log scale). The data are compared with PYTHIA 6.4 Tune Z1. Rick Field – Florida/CDF/CMS
UE Common Plots Rick Field – Florida/CDF/CMS
“Tevatron” to the LHC ATLAS CMS CDF CDF ALICE CDF Rick Field – Florida/CDF/CMS
“Tevatron” to the LHC CMS ATLAS CDF CDF ALICE CDF Rick Field – Florida/CDF/CMS
New CDF MB Data CMS CDF CDF CDF • New Corrected CDF data at 300 GeV, 900 GeV, and 1.96 TeV on on pseudo-rapidity distribution of charged particles, dN/dh, with pT > 0.5 GeV/c. Events are required to have at least one charged particle with |h| < 0.8 and pT > 0.5 GeV/c. The data are corrected to the particle level with errors that include both the statistical error and the systematic uncertainty. Rick Field – Florida/CDF/CMS
CDF versus CMS CDF slightly higher than CMS! • CDF and CMS data at 900 GeV on the pseudo-rapidity distribution, dN/dh, for charged with pT > 0.5 GeV/c and |h| < 0.8 for events with at least one charged particle with pT > 0.5 GeV/c and |h| < 0.8. The data are corrected to the particle level with errors that include both the statistical error and the systematic uncertainty. CDF slightly higher than CMS! CDF slightly higher than LHC! • CDF and CMS data at 900 GeV/c on the charged particle density in the “transverse” region as defined by the leading charged particle (PTmax) for charged particles with pT > 0.5 GeV/c and |h| < 0.8. The data are corrected to the particle level with errors that include both the statistical error and the systematic uncertainty. Rick Field – Florida/CDF/CMS
Overall Charged Particle Density • Corrected CDF data on the pseudo-rapidity distribution, dN/dh, for charged with pT > 0.5 GeV/c and |h| < 0.8 for events with at least one charged particle with pT > 0.5 GeV/c and |h| < 0.8. • Corrected CDF and CMS data overall density of charged particles with pT > 0.5 GeV/c and |h| < 0.8 for events with at least one charged particle with pT > 0.5 GeV/c and |h| < 0.8 plotted versus the center-of-mass energy (log scale). The data are corrected to the particle level with errors that include both the statistical error and the systematic uncertainty. Rick Field – Florida/CDF/CMS
MB versus the UE • Corrected CDF and CMS data on the overall density of charged particles with pT > 0.5 GeV/c and |h| < 0.8 for events with at least one charged particle with pT > 0.5 GeV/c and |h| < 0.8 and on the charged particle density, in the “transverse” region as defined by the leading charged particle (PTmax) for charged particles with pT > 0.5 GeV/c and |h| < 0.8 with 5 < PTmax < 6 GeV/c. The data are plotted versus the center-of-mass energy (log scale). Amazing! Rick Field – Florida/CDF/CMS
“Transverse”/Overall Amazing! • Corrected CDF and CMS data on the charged particle density ratio, in the “transverse” region as defined by the leading charged particle (PTmax) for charged particles with pT > 0.5 GeV/c and |h| < 0.8 for 5 < PTmax < 6 GeV/c. The ratio corresponds to the “transverse” charged particle density divided by the overall charged particle density. The data are plotted versus the center-of-mass energy (log scale). • Corrected CDF and CMS data on the charged particle density ratio, in the “transverse” region as defined by the leading charged particle (PTmax) for charged particles with pT > 0.5 GeV/c and |h| < 0.8. The ratio corresponds to the “transverse” charged particle density divided by the overall charged particle density. Rick Field – Florida/CDF/CMS
Summary & Conclusions What we are learning should allow for a deeper understanding of MPI which will result in more precise predictions at the future LHC energy of 13 TeV! • The “transMIN” (MPI-BBR component) increases much faster with center-of-mass energy than the “transDIF” (ISR-FSR component)! Previously we only knew the energy dependence of “transAVE”. • The “transverse” (i.e. “transAVE”) increases faster with center-of-mass energy than the overall charged density (Nchg ≥ 1)! Soon we will have at lot of MB & UE data at 300 GeV, 900 GeV, 1.96 TeV, 7 TeV, and 8 TeV! We can study the energy dependence more precisely than ever before! Rick Field – Florida/CDF/CMS