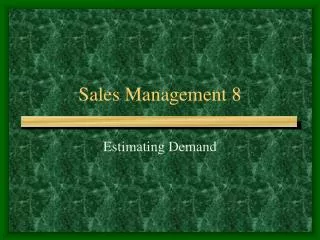
Sales Management 8
Sales Management 8. Estimating Demand. Market Potential. Sales. Industry Forecast. (Industry Forecast ≤ Market Potential). (Company Forecast ≤ Company Potential). Company Potential. Company Forecast. 0. Time. Key Terms. Market Potential: All possible sales

Sales Management 8
E N D
Presentation Transcript
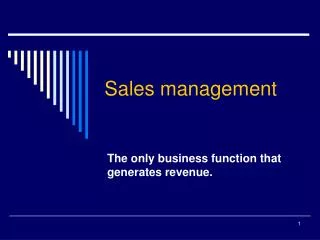
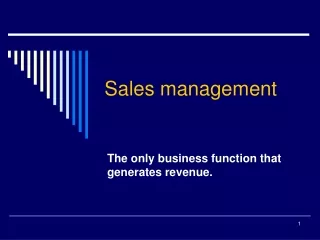
Sales Management 8 Estimating Demand
Market Potential Sales Industry Forecast (Industry Forecast ≤ Market Potential) (Company Forecast ≤ Company Potential) Company Potential Company Forecast 0 Time
Key Terms • Market Potential: All possible sales • Industry Forecast: Likely sales, all companies • Company Potential: All possible sales for one company • Company Sales Forecast: Likely company sales NB: All figures are expressed for a period of TIME.
So how do you estimate demand? • Determine WHO will use the product. • Which segment(s)?; Size? • Determine their RATE of use. • New/Replacement; Frequency. • WHO buys product? • Purchasing agent, parent, lover, uncle • WHAT is their motivation to purchase? • Life event, new business, new market, fun
Why Forecast Sales? • Allocate resources • Control operations • Project Cash Flow (Important!) • Capital/operating budgets • Production schedules & Inventory control • Hiring; collective bargaining • Planning marketing and sales plans
Methods of Forecasting • Subjective • Users’ Expectations • Sales Force Composite • Jury of Executive Opinion • Delphi Technique
Users’ Expectations • Also called Buyers’ Intentions method • Focus Groups • Surveys • Intention ≠ Behavior, but does correlate
Sales Force Composite • Salespeople are boundary-spanners • Close to customers, competitors • Fingers on the pulse of the market • Survey sales force, and add up estimates • Good starting point; need adjustment
Jury of Executive Opinion • Top/key executives, perhaps outside consultants, give best estimate • Not boundary spanners, but see “Big Picture” • May need discussion to reach an estimate that everyone can agree on
Delphi Technique • Similar to Executive Opinion • Iterative/Secret Process • Convergence
Methods of Forecasting • Objective • Market Test • Time Series Analysis • Moving Averages • Exponential Smoothing • Decomposition • Statistical Demand Analysis
Test Market • Pick “representative” city • Full marketing effort • Extrapolate results to rest of nation • Expensive • Takes time • Tip your hand • Competitors can skew results
Time Series Analysis • Use historical (not hysterical) data to predict future • Like driving by looking in the rear-view mirror • Estimate starts in “ballpark” (not the franks)
Moving Averages • Average last n (=2,4, whatever) years sales to predict the coming year 2005: 5,000 units 2006: 8,000 units 2007: 8,000 units 2008: 7,000 units estimated
Decomposition • Apply to monthly or quarterly data • Account for: • Trends • Cycles • Seasons • Random occurrences
Statistical Demand Analysis • Use regression or other techniques to determine relationship between sales and predictor factors. • Need good data and analytical skills. • Example: • Home heating oil demand = Function of temperature, sun, last fill, tank size, & history.
What do companies use? • They tend to rely more heavily on qualitative than quantitative. • Especially sales force composite and jury of executive opinion. • Easier, quicker, perhaps accurate enough
Sales Territories • Design territories • Need a market index to compare • Industrial Goods • Standard Industrial Classification • North American Industrial Classification System • Consumer goods • Buying Power Index = (5I + 2P + 3R)/10 • % disposable personal Income • % US Population • % total Retail sales