Download
1 / 5
50 likes | 243 Vues
Pelican Point, Slocum Creek, Cherry Point MCAS Summary April 2, 2004 to June 1, 2004. Fish group 1: 04/02/04 14:04 through 04/16/04 10:02 Fish group 2 04/16/04 13:59 through 04/30/04 10:14 Fish group 3: 04/30/04 13:29 through 05/14/04 10:19

E N D
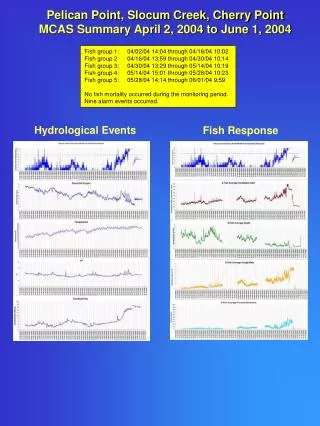
Pelican Point, Slocum Creek, Cherry Point MCAS Summary April 2, 2004 to June 1, 2004 Fish group 1: 04/02/04 14:04 through 04/16/04 10:02 Fish group 2 04/16/04 13:59 through 04/30/04 10:14 Fish group 3: 04/30/04 13:29 through 05/14/04 10:19 Fish group 4: 05/14/04 15:01 through 05/28/04 10:23 Fish group 5: 05/28/04 14:14 through 06/01/04 9:59 No fish mortality occurred during the monitoring period. Nine alarm events occurred. Hydrological Events Fish Response
Event 1 (4/9/04 09:04 through 4/9/04 09:19) The 15-minute alarm event was caused by increased fish ventilatory rate and average ventilatory depth. The alarm event was linked to maintenance activity within the biomonitoring facility. Event 2 (04/12/04 12:47-13:02, and 04/12/04 14:02-14:32): Alarm events were caused by increased ventilatory rate and average ventilatory depth. This resulted in both an increased ventilatory rate and average ventilatory depth. The alarm event was linked to maintenance activity within the biomonitoring facility.
Event 3 (05/19/04 19:16-19:31 and 20:46-21:01) The alarm events were caused by increase ventilatory rate. Water quality did not appear to be changing dramatically when compared to periods of no alarm response. Event 4 (05/20/04 14:01-16:01) The alarm events were caused by increased ventilatory rate and cough rate. Water quality did not appear to be changing dramatically when compared to periods of no alarm response. Event 5 (Multiple responses 05/22/04 23:38 through 05/28/04 10:23) The alarm events were caused primarily by increased ventilatory rate and cough rate. A corollary increase in conductivity (from 5 to 17 mS/cm) and decreasing dissolved oxygen (from 6.6 to 1.8 mg/L) likely contributed to the alarm event. The increased cough rates, low dissolved oxygen, and increasing conductivity may have indicated an inflowing algal bloom from the Neuse River Estuary.
Event 1 (4/9/04 09:04 through 4/9/04 09:19) The 15-minute alarm event was caused by increased fish ventilatory rate and average ventilatory depth. The alarm event was linked to maintenance activity within the biomonitoring facility. Event 2 (04/12/04 12:47-13:02, and 04/12/04 14:02-14:32): Alarm events were caused by increased ventilatory rate and average ventilatory depth. The alarm event was linked to maintenance activity within the biomonitoring facility.
Event 3 (05/19/04 19:16-19:31 and 20:46-21:01) The alarm events were caused by increased fish ventilatory rate. Water quality did not appear to be changing dramatically when compared to periods of no alarm response. Event 4 (05/20/04 14:01-16:01) The alarm events were caused by increased ventilatory rate and cough rate. Water quality did not appear to be changing dramatically when compared to periods of no alarm response. Event 5 (Multiple responses 05/22/04 23:38 through 05/28/04 10:23) The alarm events were caused primarily by increased ventilatory rate and cough rate. A corollary increase in conductivity (from 5 to 17 mS/cm) and decreasing dissolved oxygen (from 6.6 to 1.8 mg/L) likely contributed to the alarm event. The increased cough rates, low dissolved oxygen, and increasing conductivity may have indicated an inflowing algal bloom from the Neuse River Estuary.