Download
1 / 26
260 likes | 417 Vues
Bureau of Labor Statistics. Reconciling User Costs and Rental Equivalence: Evidence from the U.S. Consumer Expenditure Survey. Thesia I. Garner* Randal Verbrugge* Division of Price and Index Number Research U.S. Bureau of Labor Statistics

E N D
Bureau of Labor Statistics Reconciling User Costs and Rental Equivalence: Evidence from the U.S. Consumer Expenditure Survey Thesia I. Garner* Randal Verbrugge* Division of Price and Index Number Research U.S. Bureau of Labor Statistics The 2008 World Congress on National Accounts and Economic Performance Measures for Nations May 12–17, 2008 Arlington, VA *All errors, misinterpretations and omissions are ours. The analysis, views, and conclusions expressed in this paper are those of the authors; they do not reflect the views or policies of the Bureau of Labor Statistics or the views of other BLS staff members. Results are preliminary and not to be quoted without authors’ permission.
Some Questions Our Analysis Will Help Answer • Do user costs and rents for owner-occupied dwellings diverge at the micro level? • Do micro-data, same housing units, yield similar answers? • Answer has implications for • Wealth measurement • Price measurement • “Efficiency” of real estate markets • What does the user cost vs. rents comparison look like? • Across time • Across values (do we see a crossover for high-value properties) • Across cities • Different “horizon”/methods of computing user costs • What is the rent/value ratio in various cities, and how has it changed lately? • Were homes overvalued in this period? • What influences reported rents (rental equivalence)?
Rental Equivalence in the CE What would you say that your dwelling would rent for monthly unfurnished and without utilities? • Asked in section focused on ownership costs • Market value of owned home asked in an earlier section, 4 sections earlier
Data: U.S. Consumer Expenditure Interview Survey • Data collected between 2004q1 and 2007q1 • n=97,434 • Each consumer unit interviewed 5 consecutive quarters using CAPI • Current market value • Rental equivalence • Mortgage information • Housing structure type • Consumer unit income (with “new” imputes) • Property taxes, maintenance and repair, home insurance • Sample restrictions • Second interviews only • 28 largest PSUs (cities) in U.S. • Primary residences that are not condos or coops • Single detached home 85.6% • Mobile home 3.5% • Other 10.9% • Family types (to compute average and marginal tax rates) • Outliers removed • n=6,184
Other Data: User Costs Computations and Regressions • IRS income tax tables for 2003-2006 • Federal income tax filer status (weighted %) • Wife/Husband with and without children 74.1% • Single parents 4.2% • Single consumer units living alone 21.7% • Not classified <0.01% • CMHPI data • Weighted repeat-sales • Freddie-Mac data • Appreciation forecasts • National 30-year fixed mortgage rates by year and quarter • National rental unit vacancy rates by year and quarter
Averages: Computations, and Regression Results • Calculated user costs • -$3,789 with 1-year forecast • $9,326 with 4-year forecast • $28,332 with no appreciation forecast • Reported rents • $19,355 with some extremely low and high values • Estimated annual rental equivalence • $20,458 log linear model, 1-year appreciation forecasts, user costs inputs • $20,454 log linear model, 4-year appreciation forecast, user costs inputs • $20,585 log linear model, out-of-pocket expenses replacing user costs inputs • Out-of-pocket spending (adjusted for income tax preference) is less than reported and predicted rents • $10,935 • CE interview respondents are clearly thinking about more than just out-of-pocket costs
Bubbles? (Modified Smith/Smith) • Value = pdv of: rent – costs + tax benefits • Costs: property taxes, maintenance & repair, insurance • Assumptions: buy & hold forever; interest-only loan; itemize deductions • Rent and costs grow at rate 3%, reference rate = 6% (as in Smith/Smith),M&R+1% • V = [R-(1-t)(prop.tax) – M&R]/.03 + [t*i*P]/.06
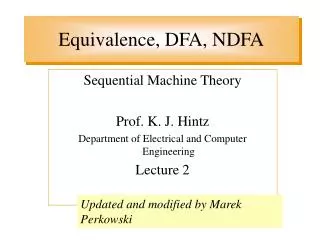
Rents vs. User Costs, Annualized 4-yr. Expected Appreciation
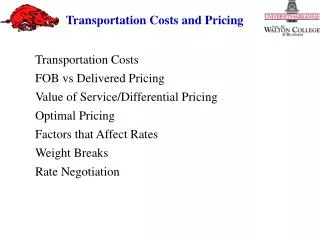
Rents vs. User Costs, Annualized 4-yr. Expected Appreciation
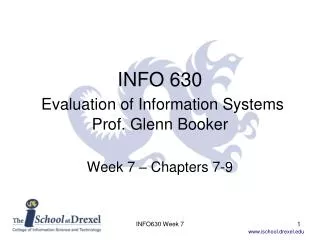
Rents vs. User Costs, Annualized 4-yr. Expected Appreciation
“Explaining” Reported Rental Equivalence (Table) • Reported rental equivalence rises with value (see curvature noted earlier) • Rooms separately valued • Single detached units enjoy a premium • Rents fall when interest rates rise, contrary to theory • Rents • don’t simply track out-of-pocket expenses (elasticity << 1) • not related to 1-yr appreciation • are positively related to (annualized) 4-yr (yet unrelated to vacancies): ? • Tax rate of HH • Enters significantly, contrary to theory • Income of HH enters significantly • Proxy for neighborhood quality? • Rents flat over this period (real rent decline)
Conclusions • CE micro data analysis yields same basic conclusions as do aggregated, indexed-based analyses • Divergence between rents and user costs • Less divergence with longer-horizon forecasts • Dollar values for rent/value ratios • Some support for Smith/Smith finding of fundamentals-based pricing • We find that high-end homes are overpriced • Reported rental equivalence issues: • Don’t simply track costs, but … • Current homeowner tax rates influence it (!) • Vacancies and 1-yr expected appreciation do not (?) • Interest rates and annualized 4-yr appreciation do, but in a puzzling manner
Data Collection Issues and Challenges • Starting in 2007Q2, home value will be asked every quarter • Little data on neighborhood, structure amenities, quality • Insufficient sample to estimate effects of Census Tract • Would be nice to see systematic verification process for several answers in CE, such as reported rental equivalence