Download
1 / 24
320 likes | 767 Vues
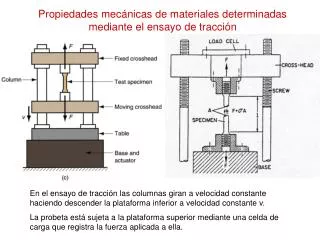
Propiedades mecánicas de materiales determinadas mediante el ensayo de tracción. En el ensayo de tracción las columnas giran a velocidad constante haciendo descender la plataforma inferior a velocidad constante v.

E N D
Propiedades mecánicas de materiales determinadas mediante el ensayo de tracción En el ensayo de tracción las columnas giran a velocidad constante haciendo descender la plataforma inferior a velocidad constante v. La probeta está sujeta a la plataforma superior mediante una celda de carga que registra la fuerza aplicada a ella.
Tensión (S) y deformación (e) de Ingeniería Engineering stress: S = F/A0 Original area Engineering strain:
Curva tensión (S) – deformación (e) de Ingeniería UTS MPa Tensile stress – strain curve
Definiciones • Yield strength (Y) • Stress at which plastic deformation starts to occur • Young’s modulus (E) S = E·e • The slope of the linear elastic part of the curve • Ultimate tensile strength (UTS) • Maximum engineering stress • Stress at which necking or strain localization occurs • 2% Offset yield strength Y(0.002)
Tension test sequence Figure 3.2 Typical progress of a tensile test: (1) beginning of test, no load; (2) uniform elongation and reduction of cross‑sectional area; (3) continued elongation, maximum load reached; (4) necking begins, load begins to decrease; and (5) fracture. If pieces are put back together as in (6), final length can be measured.
Note: In this figure, length is denoted by lower case l. Figure 2.2 (a) Original and final shape of a standard tensile-test specimen. (b) Outline of a tensile-test sequence showing stages in the elongation of the specimen.
Ductilidad • Ductility: Measure of the amount of plastic deformation a material can take before it fractures. • % Elongation to Fracture: • % El is affected by specimen gage length. Short specimens show larger % El • % Reduction in Area • No specimen size effect when area in necked region is used
Instantaneous area Tensión(σ) y deformación verdadera (ε) True stress: True strain: Fig. 3.1 M. P. Groover, “Fundamentals of Modern Manufacturing 3/e” John Wiley, 2007
P y P x True Stress (σ) & Strain (ε) • More Accurate Measurement • True Stress • True Strain
Engineering Stress (S) /Strain (e) vs. True Stress (σ) /Strain (ε) True Stress & Engineering Stress (Up to necking) True Strain & Engineering Strain (Up to necking) Conservación de volumen: A·l = A0·l0
Relación entre deformación de Ingeniería y Deformación Verdadera
Relación tensión verdadera y tensión de ingeniería S S S S Seng = σtrue·exp (- ε) ; σtrue = S·exp (ε)
Comparación curvas tensión – deformación de ingeniería y verdadera Trazo negro, la deformación se mide con el área del cuello ε a la tensión máxima (UTS) e a la tensión máxima (UTS)
True Eng. True Stress-Strain Curve • Constitutive Eq. • (plastic range) • K :strength coefficient • (true stress at unit true strain) • n :strain hardening exponent • ( coeficiente de endurecimiento • por deformación)
Coeficiente de endurecimiento por deformación (n) • Se puede demostrar fácilmente que la deformación verdadera εFmax cuando se llega a la carga máxima es igual a n. • F = σ·A • dF= dσ·dA+A·dσ=0 Condición carga máxima • dσ/σ = - dA/A = dl/L= dε (conservación de volumen) • dσ/dε =σ Si σ = K·εn • n·K·εn-1 = K·εn Se llega a n= ε • Por tanto el valor de n sirve para estimar la magnitud de la deformación a la carga máxima y consecuentemente la deformación homogénea que se puede aplicar a un material.
Transición elasto-plástica • El comportamiento elástico termina cuando comienza a producirse deformación plástica, la que ocurre por desplazamiento de dislocaciones (irreversible) • La tensión de fluencia o límite elástico señala el inicio perceptible de la deformación plástica. • En algunos metales (Cu, Al, etc) es difícil determinar la tesnión de fluencia, por tanto convencionalmente se define ésta como el nivel de tensión desde el cual, descargando elásticamente, queda una deformación plástica de 0,2% (0,002)
Tensión de fluencia o límite elástico al subir la temperatura • La tensión de fluencia se reduce al subir la temperatura, por esto un material en caliente ofrece menos resistencia a la deformación plástica • La tensión de fluencia de un acero de 0,15%C, a 25ºC es 500 Mpa, a 220ºC es 400MPa y a 600ºC es 200MPa
At “high” temperature strain rate is important, but strain hardening is not so important To calculate the flow stress at “high” (T/TM>0.5) temperature we will use: At “low” temperature strain hardening is important, but strain rate is not so important To calculate the flow stress at “low” (T/TM<0.5) temperature we will use: