MAD Mean Absolute Deviation
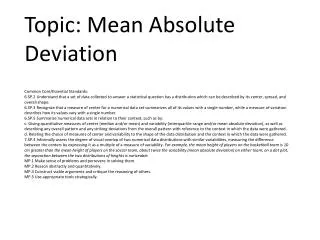
MAD Mean Absolute Deviation. How can you describe how far apart the responses are from the center in a data set?. In this lesson you will learn how to describe the distribution of data by using the mean absolute deviation MAD. The mean of a set of data is the average.

MAD Mean Absolute Deviation
E N D
Presentation Transcript
MAD Mean Absolute Deviation
How can you describe how far apart the responses are from the center in a data set?
In this lesson you will learn how to describe the distribution of databy using the mean absolute deviation MAD.
The mean of a set of data is the average. 0 + 0 + 0 + 1 + 1 + 1 + 2 + 2 + 3 + 4 + 5 + 5 = 24 24 ÷ 12 = 2
The mean and mean absolute deviation are often confused because they both include the word, “mean.” Mean absolute deviation Mean
Find the mean absolute deviation. 2 2 2 1 1 1 0 0 1 2 3 + 3 18 18 ÷ 12 = 1.5 • 2 • 2 • 2 1 1 1 1 0 0 3 3
Find the mean absolute deviation. How many different states have you visited? 1, 2, 2, 3, 4, 5, 6, 7, 12, 18
Find the mean absolute deviation. How many different states have you visited? 1, 2, 2, 3, 4, 5, 6, 7, 12, 18 Mean is 6. Find each number’s distance from 6
Find the mean absolute deviation. How many different states have you visited? 1, 2, 2, 3, 4, 5, 6, 7, 12, 18 5 4 4 3 2 1 0 1 6 12
Find the mean absolute deviation. How many different states have you visited? 1, 2, 2, 3, 4, 5, 6, 7, 12, 18 5 4 4 3 2 1 0 1 6 12 38 ÷ 10 = 3.8 MAD is 3.8
Find the mean absolute deviation. What does it say about the data? How many pets do you have? 0, 1, 5, 0, 3, 1, 0, 2, 2, 6
Find the mean absolute deviation. What does it say about the data? How many pets do you have? 0, 0, 0, 1, 1, 2, 2, 3, 5, 6
Find the mean absolute deviation. What does it say about the data? How many pets do you have? 0, 0, 0, 1, 1, 2, 2, 3, 5, 6 Mean is 2
Find the mean absolute deviation. What does it say about the data? How many pets do you have? 0, 0, 0, 1, 1, 2, 2, 3, 5, 6 2 2 2 1 1 0 0 1 3 4 How far from 2??
Find the mean absolute deviation. What does it say about the data? How many pets do you have? 0, 0, 0, 1, 1, 2, 2, 3, 5, 6 16 ÷ 10 = 1.6 MAD is 1.6
What is the mean absolute deviation of each data set and what does it mean? How many pairs of shoes do you own? 3, 7, 2, 8, 3, 19, 5, 9 How many books did you read this summer? 3, 6, 2, 3, 3, 1, 0, 5, 4, 3
In this lesson you will learn how to summarize the spread of data with a single number by calculating and examining the range and mean absolute deviation of the data.
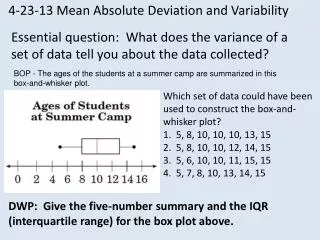
Reading a line plot How many books did 6th graders at Taylor Middle School read this summer?
Sometimes students confuse the mean and the mean absolute deviation. Mean Mean Absolute Deviation Center Spread
Finding the Range 5 -0 5
Comparing the Range and the Mean Absolute Deviation Range = 5 Mean Absolute Deviation = 1.5
Find the range and mean absolute deviation of this data. How can we use these to describe the spread of data?
Find the range and mean absolute deviation of this data. How can we use these to describe the spread of data? Range is 6 MAD is 1.6
Find the range and mean absolute deviation of this data. How can we use these to describe the spread of data?
Find the range and mean absolute deviation of this data. How can we use these to describe the spread of data? Range is 10 MAD is 2.12
Find the range and mean absolute deviation of this data. How can we use these to describe the spread of data? How many pairs of shoes do 6th graders at Wilson Junior High School own?
Find the range and mean absolute deviation of this data. How can we use these to describe the spread of data? How many pairs of shoes do 6th graders at Wilson Junior High School own? Range is 18 MAD is 3.07