Download
1 / 13
130 likes | 368 Vues
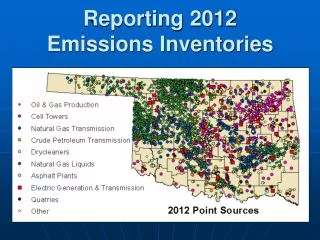
Reporting under the SoE Emissions. Hana Prchalova, CENIA. SoE Emissions to Water. New SoE reporting: since 2008 1st. Year: test phase – simple structure, one table only Regular reporting – database structure Aim of reporting: compile indicator fact sheets, EEA assessment

E N D
Reporting under the SoE Emissions Hana Prchalova, CENIA Event/ date: West Balkan meeting, 18 – 19 June 2013, Skopje Author: Hana Prchalova, CENIA
SoE Emissions to Water • New SoE reporting: since 2008 • 1st. Year: test phase – simple structure, one table only • Regular reporting – database structure • Aim of reporting: compile indicator fact sheets, EEA assessment • Source of data: existing national and/or regional sources • Emission data required under European directives: E-PRTR, UWWTD, WFD, Eurostat • Other SoE reporting: Transitional, coastal and marine waters quality, SoE Quantity Event/ date: West Balkan meeting, 18 – 19 June 2013, Skopje Author: Hana Prchalova, CENIA
Emission data • Aggregated annual emission load (kg or tonnes per year) of nutrients, organic matter and hazardous substances per spatial units (national river basin districts, sub-units) • Point sources, diffuse sources, detailed source categories • Gross load: emissions to an inland waterbody; do not account inland water retention (loss) processes within that water body – estimation or calculation from emission sources • Net load: total pollutant load at the river mouth or land; account for in-river processes; calculation from concentration in river and water flow volume – transitional and/or coastal waters Event/ date: West Balkan meeting, 18 – 19 June 2013, Skopje Author: Hana Prchalova, CENIA
Emission data • Selection of pollutants or substances optional form enumeration list, preferred hazardous substances (related with other directives and SoE reporting) • Puzzle or menu approach more or less detailed information (depends on availability) • Principle report once, use twice (or more) – reported emissions from E-PRTR are aggregated and added by ETC • Recommended reporting frequency: annually for point sources, every three years for diffuse sources Event/ date: West Balkan meeting, 18 – 19 June 2013, Skopje Author: Hana Prchalova, CENIA
Emission data model • 5 tables: • Spatial unit characteristics and pressures table • Nutrients and organic matter emission discharges from point sources • Nutrients and organic matter emissions from diffuse sources • Hazardous substances emission discharges from point sources • Hazardous substances emissions from diffuse sources Event/ date: West Balkan meeting, 18 – 19 June 2013, Skopje Author: Hana Prchalova, CENIA
Emission data model Event/ date: West Balkan meeting, 18 – 19 June 2013, Skopje Author: Hana Prchalova, CENIA
Guidance document • Data Dictionary; Definition ofWISE-SoE Reporting: Emissions • Emission sourcedischarges scheme and legend • Available in CIRCA • http://dd.eionet.europa.eu/ Event/ date: WestBalkan meeting, 14 – 15 September 2011, Skopje Author: Hana Prchalova, CENIA
Emission source discharges scheme Event/ date: West Balkan meeting, 18 – 19 June 2013, Skopje Author: Hana Prchalova, CENIA
Emission source categories • Point sources • Point sources to coastal and transitional waters: • D0Direct Discharges (total) • Point sources to inland waters: • U1Urban Waste Water Untreated (U11-U14) • U2Urban Waste Water Treated (U21-U24) • I3Industrial Waste Water Treated • I4Industrial Waste Water Untreated • O5Other Waste Water Treated • O6Other Waste Water Untreated • G7Point Sources to GW (total) Event/ date: West Balkan meeting, 18 – 19 June 2013, Skopje Author: Hana Prchalova, CENIA
Use of other sources of emissions data • E-PRTR – discharges from big facilities (UWWTPs above 100 000 p.e., industrial facilities ; data on facility level, about 70 pollutants) – added by ETC • UWWTD – discharges from existing or planned UWWTPs above 2000 p.e., BOD, COD, N and P; data on plant level Event/ date: West Balkan meeting, 18 – 19 June 2013, Skopje Author: Hana Prchalova, CENIA
Use of other sources of emissions data • Eurostat (JQ, Table 8) – discharges from UWWTPs, untreated urban waste water, treated and untreated discharges from industrial facilities not connected on UWWTPs (industrial WWTPs); BOD, COD, N, P, heavy metals; data on country or regional (RBD) level • Water Framework Directive – reporting requirements not clear now, however detailed inventory of emission sources and quantification of emission load is required for all pollutants (including priority substances) Event/ date: West Balkan meeting, 18 – 19 June 2013, Skopje Author: Hana Prchalova, CENIA
SoE Emission data structure Event/ date: West Balkan meeting, 18 – 19 June 2013, Skopje Author: Hana Prchalova, CENIA
Thank you for your attention Event/ date: West Balkan meeting, 18 – 19 June 2013, Skopje Author: Hana Prchalova, CENIA