Watershed TP Limit Setting Process and Modeling
80 likes | 205 Vues
Watershed TP Limit Setting Process and Modeling. Steve Weiss MPCA. Background. Old Policy (in general) State Rule – “affect” Restrict new discharge Wait for TMDL approval by EPA 2009 Petition to remove NPDES delegation TP Limits not restrictive enough Reasonable Potential (RP)

Watershed TP Limit Setting Process and Modeling
E N D
Presentation Transcript
Watershed TP Limit Setting Process and Modeling Steve Weiss MPCA
Background • Old Policy (in general) • State Rule – “affect” • Restrict new discharge • Wait for TMDL approval by EPA • 2009 Petition to remove NPDES delegation • TP Limits not restrictive enough • Reasonable Potential (RP) • Water Quality Based Effluent Limits (WQBELs) • New Policy (in general) • Federal Regulations – “cause or contribute” • Apply WQBELs prior to TMDL completion.
Process 1. Estimate Load Sources • Point sources – simple • Nonpoint • Landcover – EMC • Load monitoring – Flux 2. Estimate Necessary Reductions • Consider other TMDLs • Lakes and reservoirs • Bathtub – simple tool, results compatible with standards • Rivers – near future • HSPF output, load duration curves, mass balance
Process (Continued) 3. Slice the Pie • 4 scenario sequence • Current • NPDES Weighted • Nonpoint Weighted • Balanced
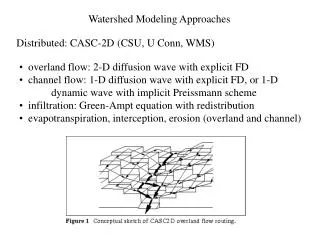
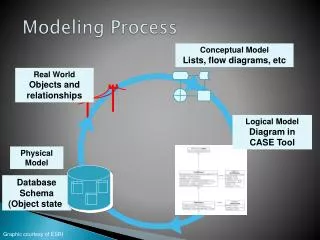
Sauk River Watershed Routing Diagram No Significant NPDES Permittees NPDES Permittees NPDES Permittees City of Osakis Nonpoint source Runoff Nonpoint source Runoff Nonpoint source Runoff Nonpoint source Runoff Lake Osakis Bath tub model TBC Sauk Lake Bath tub model TBC SRCL Bath tub model completed Inflow WQ TP<100ug/L Inflow WQ TP = 60 ug/L Inflow WQ TP<100ug/L Outflow WQ TP ~ 40 Outflow WQ TP ~ 40 ug/L Outflow WQ TP=54 ug/L Includes Sauk R. & other minor tribs SR Watershed Outlet TP=100 ug/L
Sauk River Chain of Lakes (SRCL) • 11 NPDES Permittees • 4 MNG49’s • Lake Modeling Completed • Sauk River < 60ug/L TP Summer Avg. • 68% reduction to Sauk River
Final Thoughts • Optimally WQBEL = WLA • If your watershed has NPDES permits, check w/ Marco or me about TP limits. • HSPF / SWAT output very useful for limit setting process, especially with Rivers