Download

1 / 38
380 likes | 476 Vues
O IL W ELL M ONITORING S YSTEM. Presented By:- Louis Bengtson Kaleb Stunkard Jimit Shah. M OTIVATION. More than 27,000 oil wells permanently abandoned in the Gulf of Mexico. Currently, there is no monitoring system available. Four teams: Buoy Team (Mechanical Engineering)

E N D
OILWELLMONITORINGSYSTEM Presented By:- Louis Bengtson KalebStunkard Jimit Shah
MOTIVATION • More than 27,000 oil wells permanently abandoned in the Gulf of Mexico. • Currently, there is no monitoring system available. • Four teams: • Buoy Team (Mechanical Engineering) • Bi-directional Turbine Team (Mechanical Engineering) • Sensor Team (Mechanical Engineering) • Electrical Team (Electrical Engineering)
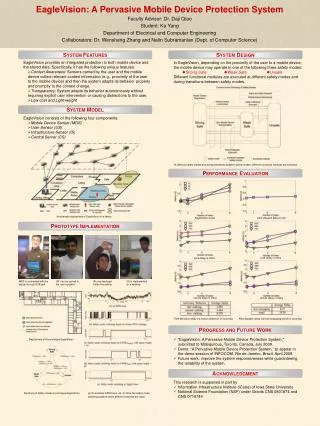
Turbine Ginlong Generator System Block Diagram INPUT CIRCUIT BOOST CONVERTER (AC-DC Rectifier) CONTROL PROCESSOR BUCK CONVERTER Sensor BATTERY CHARGING CIRCUIT Electrical System
GOALS & OBJECTIVES • Efficiently convert varying AC voltage to steady DC voltage. • Be able to charge a battery that will supply the necessary output voltage to the sensors. • Must be self powered. • Must perform PFC on the AC signal. • Must be able to work in high and low pressure environment. • Must be suitable for dry and wet conditions.
SPECIFICATIONS • Input RPM range: 90 to 125 RPM • Input Voltage range: 20VAC to 30VAC • Output Current: 3A • Output Voltage: 12VDC • Cost: Less than $2,000 • Efficiency: 85% • Operating Environments • Temperature: 25 to 110°F • Humidity: 100%
Input Circuit - KalebStunkard
BOOSTCONVERTER,BUCKCONVERTER &BATTERYCHARGINGCIRCUIT - Jimit Shah
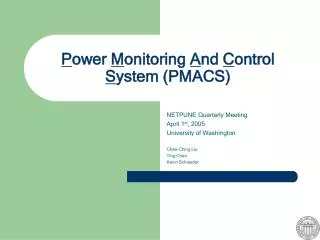
Block Diagram 200V +5 V 200 - 16V ACRECT BOOST CONVERTER BOOSTGATE 200V BUCK CONVERTER BKPDONE BUCKGATE GND 12 V BATTERY CHARGER Vout Input Output Output to Input Circuit Output to Control Processor
Top View Side View
Buck Topology Schematic BKPDONE
Top View Side View
Microcontroller - Louis Bengtson
Advantages of dsPIC • Extensive available parameters • Inexpensive • Programmable in C • Compatibility with development tools • Allows use of PFC algorithm • Prospect of future improvements with digital control not possible with analog implementation
Microcontroller Functions • Control buck and boost FET gate drivers • Receive buck pulse done signal from buck converter to prevent new pulse while processing previous pulse • Interrupt and compute next period boost pulse width for power factor correction between pulses
Boost Pulse Width Formula for PFC • Tp is the pulse period • L is the Boost inductance • R is the load resistance to the AC line • Vo is the Boost output voltage • Vac is the instantaneous rectified AC voltage
Boost Pulse Width Algorithm • Add 200V internal supply reading with boost diode drop voltage to acquire effective boost switcher output voltage • Get rectified AC voltage reading and convert to 200V reading scale • Subtract AC rectified voltage from effective boost switcher output voltage to obtain boost difference voltage • If result is negative, clip at 0 • Divide boost difference voltage by boost output voltage to obtain duty cycle • Take the square root to obtain scaled pulse width, and restore original scale • Compare computed duty cycle to maximum duty cycle • If computed duty cycle is out of range, set maximum duty cycle • Set boost switcher pulse width for the next PWM period
Anticipated Problems • Generator performance • GPS • Not being able to test Boost & Buck circuits • Programming the microcontroller • Integrating microcontroller chip into PCB • PCB layout