Download

1 / 44
480 likes | 1.03k Vues
Week 4 - Biopharmaceutics and Pharmacokinetics. Pn . Khadijah Hanim bt Abdul Rahman School of Bioprocess Engineering University Malaysia Perlis. Multicompartment models: intravenous bolus administration. Pharmacokinetic models- represent drug distribution and elimination in the body.

E N D
Week 4 - Biopharmaceutics and Pharmacokinetics Pn. KhadijahHanimbt Abdul Rahman School of Bioprocess Engineering University Malaysia Perlis
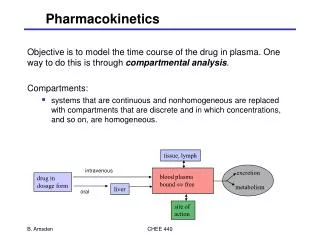
Multicompartment models: intravenous bolus administration • Pharmacokinetic models- represent drug distribution and elimination in the body. • A model should mimic closely the physiologic processes in the body • In compartmental models, drug tissue concentration is assumed to be uniform within a givenhypothetical compartment. • All muscle mass and connective tissues may be lumped into one hypothetical tissue compartment that equilibrates with drug from the central (or plasma) compartment.
Since no data is collected on the tissue mass, the theoretical tissue concentration is unconstrained and cannot be used to forecast actual tissue drug levels. • However, tissue drug uptake and tissue drug binding from the plasma fluid is kinetically simulated by considering the presence of a tissue compartment.
Multicompartment models were developed to explain and predict plasma and tissue concentrations for the behavior of these drugs. • In contrast, a one-compartment model is used when the drug appears to distribute into tissues instantaneously and uniformly.
Central compartment • These highly perfused tissues and blood make up the central compartment. • Multicompartment drugs • multicompartment drugs are delivered concurrently to one or more peripheral compartments composed of groups of tissues with lower blood perfusion and different affinity for the drug.
Two Compartment Open Model • Many drugs given in a single intravenous bolus dose demonstrate a plasma level–time curve that does not decline as a single exponential (first-order) process. • The plasma level–time curve for a drug that follows a two-compartment model shows that the plasma drug concentration declines biexponentially as the sum of two first-order processes—distribution and elimination.
A drug that follows the pharmacokinetics of a two-compartment model does not equilibrate rapidly throughout the body, as is assumed for a one-compartment model. • In this model, the drug distributes into two compartments, the central compartment and the tissue, or peripheral compartment.
Central compartment: • represents the blood, extracellular fluid, and highly perfused tissues. The drug distributes rapidly and uniformly in the central compartment. • Second compartment, • known as the tissue or peripheral compartment, contains tissues in which the drug equilibrates more slowly. • Drug transfer between the two compartments is assumed to take place by first-order processes.
Distribution phase- represents the initial, more rapid decline of drug from the central compartment into tissue compartment (line a) • distribution phase- drug elimination and distribution occur concurrently • Net transfer of drug from central to tissue compartment • Fraction of drug in the tissue compartment during distribution phase increases to max. • At max. tissue conc. – rate of drug entry into tissue = rate of drug exit from tissue. • Drug in tissue compartment- equilibrium with drug in central compartment (distribution equilibrium) • Drug conc in both compartment decline in parallel and more slowly compared to distribution phase The decline is 1st order process and called elimination phase or β phase (line b)
Two Compartment Models • There are several possible two-compartment models
compartment 1 is the central compartment and compartment 2 is the tissue compartment. • The rate constants k12and k21represent the first-order rate transfer constants for the movement of drug from compartment 1 to compartment 2 (k12)and from compartment 2 to compartment 1 (k21).
Relationship between drug concentrations in tissue and plasma • The maximum tissue drug concentration may be greater or less than the plasma drug concentration.
The relationship between the amount of drug in each compartment and the concentration of drug in that compartment is shown by: where • DP = amount of drug in the central compartment, • Dt = amount of drug in the tissue compartment, • VP = volume of drug in the central compartment, and • Vt = volume of drug in the tissue compartment.
Drug concentration in blood and tissue • Amount of drug in blood and tissue
The rate constants for the transfer of drug between compartments are referred to as microconstantsor transfer constants, and relate the amount of drug being transferred per unit time from one compartment to the other. • The constants a and b are hybrid first-order rate constants for the distribution phase and elimination phase, respectively.
Equation • Constants a and b- rate constant for distribution phase and elimination phase • Can be write as • The constants A and B are intercepts on the y axis for each exponential segment of the curve
Method of residuals Method of residual- feathering or peeling, useful for fitting a curve to the experimental data of drug when drug does not follow one compartment model. E.g: 100 mg of drug administered by rapid IV injection to a 70-kg healthy adult male. Blood sample were taken periodically and the following data were obtained:
When data is plotted, a curved line is observed. The curved-line relationship between logarithm of the plasma conc and time indicates that drug is distributed in more than one compartment. From these data, biexponential equation, may be derived As shown in biexponential curve, the decline in initial distribution phase is more rapid than elimination phase. Rapid distribution phase confirmed with constant a being larger than constant b. at some later time Ae-at will approach 0, while Be-bt still have value. The rate constant and intercepts were calculated by method of residuals
Therefore, • In common logarithms, • From equation above, rate constant can be obtained from the slope (-b/2.3) of a straight line representing the terminal exponential phase.
The t1/2 for elimination phase (beta half life) can be derived from the following relationship: • From Eg. b was found to be 0.21 hr-1. from this info the regression line for terminal exponential or b phase is extrapolated to the y axis; y intercept = B or 15um/mL.
Values from the extrapolated line are then substracted from the original expremental data points and a straight line is obtained. This line represents the rapidly distributed a phase • The new line obtained by graphing the logarithm of residual plasma conc (Cp- C’p) against time represents the a phase. The value for a is 1.8 hr-1 and y intercept is 45ug/mL. elimination half life, t1/2 computed from b, has the value of 3.3 hr.
A no of pharmacokinetic parameters may be derived by proper substitution of rate constants a and b and y intercepts A and B to following equations:
Apparent Volumes of distribution • VD- parameter that relates plasma conc (Cp) to the amount of drug in the body (DB) • Drugs with large extravascular distribution/ high peripheral tissue binding- the VD is generally large • Polar drugs with low lipid solubility- VD is small
Volume of the Central compartment • Useful to determine drug conc. after IV injection • Also refered as Vi = initial VD as the drug distributes within plasma and other body fluids • Vi- generally smaller than terminal VD after drug distribution to tissue is completed • Vol of central compartment- generally greater than 3L
For polar drugs, initial Vol of 7-10 L- interpreted as rapid drug distribution wthin plasma and extracellular fluids • E.g: Vp of hydromorphone about 24 L- possibly becoz of rapid exit from plasma into tissues even during initial phase. • As in the case of one-compartment model- Vp determined from the dose and instantaneous Cp. • Vp useful in determination of drug clearance if k is known
In two-compartment model, Vp considered as mass balance factor governed by mass balance between dose (D) and Cp • Ie. Drug conc x vol of fluid = dose at t=0 at t=0, no drug eliminated, Do= VpCp • At t=0, all of drug in the body is in central compartment
Cp0 can be shown to be equal to A and B by following equation: • At t=0, e0=1, therefore • Vp is determined from this equation by measuring A and B after feathering the curve
Alternatively, the vol of central compartment may be calculated from the similar to calculation of VD for one compartment model • for two-compartment model =
Apparent volume of distribution at steady state • At steady-state- the rate of drug entry into tissue compartment from central compartment = rate of drug exit from tissue compartment into the central compartment • Amount of drug in central compartment, Dp = VpCp,
Total amount of drug at steady state = Dt + Dp • The apparent vol of drug at steady state (VD)ss • Substitute of Dt and expresses Dp as VpCp • (VD)ss- function of transfer constants, k12 and k21= rate constants of drug going into and out of tissue compartment
Extrapolated volume of distribution • Where B= y intercept obtained by extrapolation of the b phase of plasma level curve to y axis. Can be calculated by this equation:
Volume of distribution by area • (VD)area = (VD)β – obtained through calculations similar to those used to find Vp except that rate constant b instead of elimination rate constant, k. • (VD)β calculated from total body clearance divided by b (influenced by drug elimination in the beta, or b phase).
Total body clearance = , (VD)B may be expressed as • By substitution of kVp :
Drug in the tissue compartment • Vt= apparent volume of the tissue compartment may be calculated from knowledge of the transfer rate constants and Vp: • Calculation of amount of drug in tissue compartment does not involve the use of Vt • Vt -provides an estimate for drug accumulation in the tissues -Vital in estimating chronic toxicity and duration of pharmacologic activity to dose
Drug Clearance • Clearance- vol of plasma that is cleared of drug per unit time • Clearance may be calculated without consideration of compartment model • Cl in the two-compartment model is the product of (VD)β and b
Elimination rate constant • In two-compartment, the elimination rate constant, k represents the elimination of drug from the central compartment • b represents drug elimination during the beta or elimination phase when distribution is mostly complete • Plasma-drug level curve declines more slowly in b phase- redistribution of drug out of tissue compartment • b is smaller than k • k- true elimination rate constant • b- hybrid elimination rate constant- influenced by rate transfer of drug in and out of tissue compartment
Three compartment open model • Three compartment- two compartment model + deep tissue compartment • Central compartment- distributed most rapidly- highly perfused tissues • Compartment 2- less rapidly • Compartment 3- very slowly- poorly perfused tissues, i.e. bone/ fat
Rates of flow of drug into and out of the central compartment: • A, B and C – y intercept of extrapolated lines for central, tissue and deep tissue compartment • a, b and c – 1st order rate constant
Elimination rate constant, k • Vol of central compartment • Area