Download
1 / 18
180 likes | 360 Vues
Global imbalances and exchange rates Jomo Kwame Sundaram 26 January 2010. Global imbalances grow. USD bn. 1000. Latin America. Other industrialised. 800. Other Asia. China. 600. Japan. 400. Oil exporters. 200. 0. -200. -400. United States. -600. -800. Euro Area.

E N D
Global imbalancesand exchange ratesJomo Kwame Sundaram26 January 2010
Global imbalances grow USD bn 1000 Latin America Other industrialised 800 Other Asia China 600 Japan 400 Oil exporters 200 0 . -200 -400 United States -600 -800 Euro Area Central and Eastern -1000 Europe 90 91 92 93 9495 9697 98 99 00 01 02 03 0405 06 07 2
South exports fall more Source: CPB
ST real interest rates Negative Rates 7
Bretton Woods vs Keynes • Dollar-gold parity ($35/oz.) • Permanent US current account deficit possible • Seigneurage income • Vietnam Run on Eurodollars 1971 • End of BW system • ‘Non-system’: IMF Interim Committee • Rise of Japan Plaza 2 endaka • Drucker: X border flows; K acct liberalization • Rise of China exchange rates, SWF
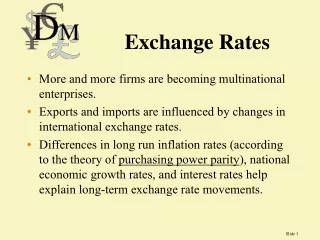
EA miracle + X rates • EP con EP: ISI + EOI; scale economies • Undervalued X rates since postwar Japan • SEA mid-80s devaluations + endaka • Unlike NEA, SEA FDI-dependent • Finance dominant, oppose $ appreciation post-1995 end of endaka 1997-98 crisis
China boom + X rates • 1994 RMB ‘devaluation’ • Contract manufacturing: learning by doing • End of TVEs boom scale economies • Productivity gains + Lewisian L market consumer price deflation + high growth • China super-competitive • Big overall trade surplus reserves accumulation from mid-2000s • $3trn USD assets, including >$1trn US T bonds • China cannot afford massive $ depreciation • Japanese endaka end of Japanese miracle
Self-protection • 1990s’ LA, EA crises accumulate reserves - no lender of last resort - onerous IMF conditionalities • No insurance element
Crisis + reserves Financial positions stronger than during Asian + LA crises (more foreign reserves, ‘better’ fiscal balances) But reserves rapidly evaporated with export collapse; fiscal space also diminished IMF late ‘09 paper (Blanchard, et al.): Reserve accumulation did not help in crisis 17
Thank you Please visit IDEAs www.networkideas.org UN-DESA esa.un.org and G24 www.g24.org websites Research papers Policy briefs Other documents 18