Download
1 / 77
780 likes | 924 Vues
Oil Prices, Spare Capacity and Speculation. Dr. Jose Noguera Associate Professor Department of Economics University of New Hampshire. AVERAGE OIL PRICE US Dollars per barrel. Steady increase since 2003. Irregular behavior between 1983 and 2002. Substantial increase

E N D
Oil Prices, Spare Capacity and Speculation Dr. Jose Noguera Associate Professor Department of Economics University of New Hampshire
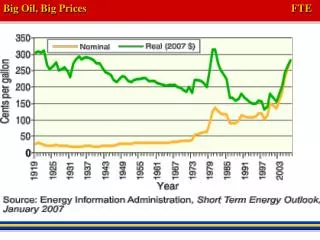
AVERAGE OIL PRICE US Dollars per barrel Steady increase since 2003 Irregular behavior between 1983 and 2002 Substantial increase between 1972 and 1982 Low prices before 1972 Source: IMF
AVERAGE REAL OIL PRICE US Dollars per barrel Prices of 2006 Steady increase since 2003 Substantial increase between 1972 and 1982 Low prices before 1972 Source: http://www.wtrg.com/prices.htm
REAL OIL PRICE BEFORE 1972 US Dollars per barrel Prices of 2006 Source: http://www.wtrg.com/prices.htm The Vietnam War Had No Effect on Oil Prices
AVERAGE OIL REAL PRICE US Dollars per barrel Prices of 2000 - Deflacted by the US CPI Irak War Venezuelan Oil Strike Asian Growth Iran – Iraq War OPEC change policy To compete in prices And increase production Iranian Revolution Gulf War I September 11th OPEC restraints production Yom Kippur War Arab Oil embargo Asian Financial Crisis Source: IMF
% Increase in AVERAGE OIL REAL PRICE Current increase in oil prices has not been as drastic as in the 1970s and 1980s Source: IMF
% Increase in AVERAGE REAL OIL PRICE AND USA REAL GDP % Increase in oil price NO RELATIONSHIP BETWEEN OIL PRICES AND RECESSIONS BEFORE 1973 % Increase in USA real GDP Source: Fed, IMF
% Increase in AVERAGE OIL REAL PRICE AND USA REAL GDP ALL RECESSIONS AFTER 1973 SEEMS RELATED TO THE OIL PRICE % Increase in oil price % Increase in USA real GDP RECESIONS Source: Fed, IMF
% Increase in AVERAGE OIL REAL PRICE AND USA REAL GDP 1973 - 2006 % Increase in USA real GDP % Increase in oil price Source: Fed, IMF
The Oil Price MechanismThe Agents OPEC Producers Oil prices Level Supply of Oil NON OPEC Producers Volatility in oil prices Demand for Oil Commercial Traders Occasional spikes in oil prices Speculators Energy companies and traditional producers Pension and Hedge Funds Investment Banks Specialized Energy trading firms
The Oil Price MechanismFactors to Analyze the Producers’ Behavior(Supply Side) Inventories OPEC Producers Oil Reserves NON OPEC Producers Spare Capacity New Investments
The Oil Price MechanismFactors to analyze Consumers’ Behavior(The Demand Side) Commercial Traders Actual Consumption Substitutes Expected Growth
The Oil Price MechanismFactors that Affect Speculation Activity Inventories OPEC Producers Oil prices Level Oil Reserves NON OPEC Producers OPEC Spare Capacity Volatility in oil prices New Investments Commercial Traders Occasional spikes in oil prices Actual Consumption US$ Exchange rate Speculators Refinery Fires Substitutes Weather Shocks Geopolitical Shocks Inflation Rate Expected Growth Temporary Bottlenecks
REGRESSION RESULTS Comments 1% Increase in 11.5% Increase in Oil Prices World Oil Supply 8) This reflects the volatility of oil prices World Aggregate Demand 4.7% decrease in Oil Prices 5.2% decrease in Oil Prices Real Interest Rate 1.8% increase in Oil Prices Depreciation Rate
REGRESSION RESULTS Before 1980, only economic activity and macroeconomic policy had influenced oil prices This means that Oil Prices were demand determined before the oil crises of the 1970s
REGRESSION RESULTS After 1980, oil prices also reflect the influence of oil supply and the exchange rate This particularly reflects the increasing market power exercised by OPEC But also the increasing role of speculation in the oil price determination
HOW CAN WE USE THIS TO ANALYZE THE CURRENT CONDITIONS OF THE INTERNATIONAL OIL MARKET? • LET US START WITH THE DEMAND SIDE. • WHO ARE THE MAIN OIL CONSUMERS
MAIN OIL CONSUMERS THIS SAMPLE OF COUNTRIES ACCOUNT FOR OVER 80% OF WORLD’S TOTAL OIL CONSUMPTION
MAIN OIL CONSUMERSShare in World Oil Consumption Slight decline in the EU importance as world oil consumer Strong decline in Former USSR importance as world oil consumers Increasing importance of China as world oil consumers
MAIN OIL CONSUMERSShare in World Oil Consumption Smaller countries tend to increase their share in oil consumption Worthy mention the fast increase of India and South Korea
THE U.S.A. ECONOMY As in previous episodes, disacceleration in GDP signals recession Unlike previous episodes, the road to recession is slower
THE U.S.A. ECONOMY Unlike the 1970s, the slowdown is not as strong even though real oil prices about 300% since 2003
THE U.S.A. ECONOMY Inflation Rate 2007 2005 2000 2002 2004 2006 2003 2001 Output Growth Rate The slowdown of 2007 shows signals of stagflation
THE U.S.A. ECONOMY Inflation Rate 2007 2005 2000 2002 2004 2006 2003 2001 Output Growth Rate There was already a signal of stagflation in 2005 but the economy still looked strong and disinflated in 2006
THE U.S.A. ECONOMY Inflation Rate 2007 2005 2000 2002 2004 2006 2003 2001 Output Growth Rate Annual growth rates have been declining during the last three years
THE U.S.A. ECONOMY Capital inflows in the USA have substantially increased during the last years
CURRENT ACCOUNT BALANCE(Share of GDP) China U.S.A. To hold down the renminbi, the Chinese government has used its current account surplus to purchased dollars (U.S. TB)
CURRENT ACCOUNT BALANCE(Share of GDP) China U.S.A. This intervention has helped funded a large share of the US external deficit and budget deficit It has also allowed the US government to hold down long-term interest rates
That has contributed to an excess liquidity that found outlet in the real estate market, causing the real estate bubble As the bubble burst and the credit crunch began As of November 2007 there is a large inventory of unsold homes This implies that prices will have to fall further in order to restore market equilibrium
How global growth will be affected by the turmoil in financial markets? First, since the turmoil began, there has been a substantial re-pricing of risk Second, spreads on asset backed securities have widened and the markets for commercial paper, high yield bonds, and interbank lending have been dramatically squeezed.
THE IMPACT OF THE PRICE OF OIL The other finding is the simultaneous increase of inflation and slowdown in output This is a clear signal of cost-pushed inflation So far, the world has collectively managed to absorb a huge price increase without much economic cost.
THE U.S.A. ECONOMY Blanchard and Gali (2007) identify four reasons: 1) Good luck (i.e. lack of concurrent adverse shocks) 2) Smaller share of oil in production 3) More flexible labor markets, and 4) Improvements in monetary policy. Still, there are limits and this is what apparently has happened
THE U.S. DOLLAR As expected, with a large US current account deficit, the dollar would fall This has improved the current account This process should continue until financial market participants are convinced that the dollar is sufficiently low to bring the deficit to a sustainable level. Interest rates in the US are lower than in Europe and tend to put downward pressure on the dollar
THE U.S. DOLLAR In addition, the fact that many central banks are known to be rebalancing their foreign currency portfolios away from dollars is also having a negative effect on the dollar A falling dollar could be inflationary in the US if it causes a sizable increase in import prices That has not happened yet, but that situation cannot go forever, and could happen if the dollar falls further
THE U.S. ECONOMYPOLICY RESPONSE The Fed has responded by cutting interest rates Although the real estate crisis should have a negative impact on US, so far it seems that it will only cause a moderate slowdown This is partly due to the absence of economic contagion to unrelated asset markets Transparency, liquidity, and credibility to financial markets has not been seriously affected either
THE U.S. ECONOMY Residential investment has dropped sharply but consumer spending, other than on home-related products, has not Export growth has accelerated The continuing drop in the value of the dollar will restrict the ability of the Federal Reserve to lower interest rates without stimulating inflationary pressures That policy is unlikely to lower inflation rate and can make the dollar fall further
EUROZONE Inflation Rate 2001 2002 2005 2006 2000 2004 2007 2003 Output Growth Rate
UNITED KINGDOM 2007 2006 Inflation Rate 2005 2003 2004 2002 2001 2000 Output Growth Rate Europe does not seem to be affected yet by either the high oil prices or the US credit crunchThe slowdown seems to be demand related
WESTERN EUROPE Although Europe is less vulnerable to US demand than in the past, it still remains vulnerable to contagion from the US credit market conditions This means that a slowdown of the US economy would have a lower impact on Europe than in the past However, some financial institutions in Europe have already experienced sizable losses and others may follow This results from their holding of securities backed by US sub-prime mortgages
WESTERN EUROPE Second, with strong currencies (euro, pound), Europe’s central banks will have some leeway to lower interest rates to stimulate domestic demand without concern about inflation This could be important as the strong currencies are hurting export growth
THE EUROPEAN REAL ESTATE BUBBLE Some European countries are at risk from inflated housing prices (UK, Spain, and Ireland) A collapse of housing prices in any of the inflated European markets could create financial losses for European banks and lead to a constriction of credit A reversal of such bubbles could have negative consequences for economic growth The rising euro is already having a negative impact on export growth
JAPAN Inflation Rate 2006 2007 2004 Output Growth Rate 2003 2005 2001 2000 2002 Slowdown in Japan also seems to be demand related. Consumption and investment in Japan appears to be slowing
THE JAPANESE ECONOMY Exports to China, Europe, and the US remain the driving force of the economy Japanese share of exports to China and Europe has increased so, a slowdown in the US will have a lower impact on Japan than in the past Looking ahead, it seems likely that the yen will appreciate, dampening export growth and contributing to Japan’s continuing deflation The latter is worrisome as the Bank of Japan has actually tightened monetary policy
THE JAPANESE ECONOMY Whether this policy will be reversed is hard to say. Japan appears to be relatively immune to the impact of higher energy prices Better energy efficiency, more nuclear energy, LNG, coal The result is that higher energy prices are not having a serious impact on growth
RUSSIA 2001 Inflation Rate 2000 2002 2003 2005 2004 2006 2007 Output Growth Rate Russia’s economy has grown exceptionally fast in recent years


![RST_LO AVDD AGND DVDD DGND RST SEL Spare Spare Spare Spare Spare Spare Spare spare ROW[0] ROW[1]](https://cdn1.slideserve.com/3115998/slide1-dt.jpg)