Download

1 / 70
710 likes | 955 Vues
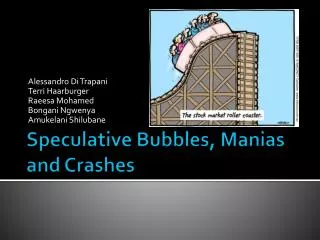
Alessandro Di Trapani Terri Haarburger Raeesa Mohamed Bongani Ngwenya Amukelani Shilubane. Speculative Bubbles, Manias and Crashes. Introduction. Speculative bubble Asset traded in high volumes Prices higher than intrinsic values ( Calverley , 2009)

E N D
Alessandro Di Trapani Terri Haarburger Raeesa Mohamed BonganiNgwenya AmukelaniShilubane Speculative Bubbles, Manias and Crashes
Introduction • Speculative bubble • Asset traded in high volumes • Prices higher than intrinsic values (Calverley, 2009) • Rapid increases in prices, followed by rapid decrease • New industries and markets • Efficient Market Hypothesis (EMH) • Assumption that investors behave rationally • Behavioural and psychological factors
Introduction • Manias • Lack of investor knowledge • Overoptimism, hype and overvaluation • Crashes • Departure from rationality short-lived • Apparent overvaluation sparks mass-selling • Liquidity problem
Structure of the Presentation • Typical anatomy of a speculative bubble • A review of past speculative bubbles • Implications of speculative bubbles on the EMH • Economically quantifiable explanations • Psychological factors that influence market performance • Current state of the market • Conclusion
Anatomy of a Speculative Bubble Allen and Gale (2000) • Three phases of a speculative bubble: • Financial liberalisation and increasing asset prices • Rapid decline in asset prices • Widespread financial default by leveraged investors Usually followed by banking and/or currency crises
Anatomy of a Speculative Bubble • Aliber and Kindleberger (2005) • “Insiders” and overoptimistic “outsiders” • Eagerness of “outsiders” drives the bubble • When eagerness of “outsiders” falls short: • Liquidity problem ensues • First stock market decline • Leveraged investors face bankruptcy
Anatomy of a Speculative Bubble • Aliber and Kindleberger (2005) • Speculators bet on looming market recovery • Disappointment causes further price declines • Further bankruptcies may cause bank failures • Further panic ensues • Price declines may even cause halt in trading • Government intervention
Tulip Mania • Illustration of speculative excess • Contract prices for the bulbs were extraordinary • First recorded speculative bubble • Netherlands was a highly commercialized country • Dutch dominated tulip market
Tulip Mania • Single bulb = 4oxen +8 swine +12 sheep +£1000 cheese +Measures of wheat, rye, beer and butter +Bed +Suit +Silver cup
Tulip Mania • Final speculative frenzy • Large amount of foreign funds • People hurriedly liquidated assets to be able to participate • Possible causes: • Bubonic plague • Formal future contracts required no margin • Consequences • Growers of bulbs left to absorb majority of the damage
South Sea Bubble • Disaster came about by bribery, corruption, robbery and jobbery • Sought a rapid expansion • Did so by acquiring British government debt • Of £50 million of British Debt, South Sea held £11.7 million • To finance debt, South Sea was permitted to expand the number of shares • Difference between par and market value
South Sea Bubble • Began to talk up its stock, which was followed by a wave of speculating frenzy. • Feeding of capital into Royal Assurance Co and the London Assurance Co • Bubble Act in June 1720 • Immediate downward pressure was placed on the price of shares of the effected companies. • Due to these shares mostly being held on margin; general selling hit the shares of all companies • International scramble for liquidity
Stock Market Crashes • Wall Street Crash of 1929 • The Dot.Com Bubble • The Sub-Prime Mortgage Crisis: The 2008 Recession
Wall Street Crash of 1929 • Most devastating crash in the history of the US • Signaled the beginning of the 12 year Great Depression
Wall Street Crash of 1929 • Causes: • Speculation • Expansion of investment trusts, public utility holding companies • Margin buying • Economic fundamentals
Dot.Com Bubble • A decade into the 21st century – lessons learnt? • Dot.Com bubble can at least be credited with the honourofcatapultingsociety into the modern technological age. • Transformation of academic network to commercial colossus – Netscape.
Dot.Com Bubble • Netscape’s browser interface • 3 million downloads in three months • ensuring its place in the record books on popularity grounds. • The perfect start to the madness • Netscape lists on the Nasdaq Composite. • Share prospectus, supply and demand, market clearing price and closing price.
Dot.ComBubble in the Making • Expansionary monetary policy. • Economic and political influence. • Technology indicators started showing signs of increase and investor optimism gained traction.
Dot.ComBubble in the Making • In 1999 the Nasdaq Composite rose by 80% in that year alone. • Tech IPO were springing up left and right – Callahan’s Summation (2003) • KUO (2001) provided examples, iVillage and Autobytel.
Dot.Com Source: www.dailyfinance.com • 2700 in September 1999 to a level in excess of 5000 by mid March 2000 = 80% in six months. • Reality began to sink in for lenders, tech startups and the Federal Reserve Bank.
The Pin Prick • Federal Reserve finally tightens the economy’s purse strings, in the early 2000’s. • Massive price corrections seen above signalled that reality had finally bitten back.
History Repeats Itself… • Sub prime crisis. • Mortgage- backed security. • Federal Reserve, pricing disqualified parties in to the market. • US Home Ownership rate peak.
History Repeats Itself… • Investment banks become involved in the mortgage market. • As much as 60% – 80% of all mortgages underwritten in the period were defective. • As much as 40% of those were securitised and sold off to investors.
The Aftermath • Top 5 Investment banks and Leverage ratios. • The fate of Lehman Brothers. • Bear Sterns and Merryl Lynch sold at fire-sale prices. • Goldman Sachs and Morgan Stanley became commercial banks. • In conjunction with Freddie Mac and Fannie Mae • US$9 trillion in debt and guarantee obligations, • yet not subject to the same regulation as depository banks.
South African Perspective • Found not be at risk of a major backslide (Massa &teVelde, 2008) • Commended by the IMF (December 2010) • Escaped the Wrath of the American • Subsequently world-wide sub prime flu. • South Africa’s continuing efforts • To remain in line with financial standards • And impose strict regulations of its own • Contributed to the strength and stability of the South African banking and investment systems.
Bubbles and the EMH • Efficient Market Hypothesis • Efficient markets consisting of rational investors • Strongest form • Security prices reflect ALLsecurity market information • Private and public information • Bubbles = Prices above intrinsic value • Not consistent with EMH • Any deviation from intrinsic value will be arbitraged away
The EMH • Assumes investors are: • Fully rational • Unaffected by emotions and the actions of others • BUT: Investors are humans! • Humans do occasionally behave irrationally! • Irrational behaviour most evident during a bubble
“Less-Than-Rational” Behaviour • Looking back at a bubble, irrationality is obvious • However, at the time investors did not think they were being irrational • Shiller (2002) • Existence of a bubble is based around less-than-rational behaviour from investors and not foolishness • Even “experts” were wrong about the market and asset price valuation
Rational Bubbles • Blanchard and Watson (1982) • Bubbles and Rational Behaviour can co-exist • Rational Arbitrageurs • Aware that securities are overvalued and that the market will eventually collapse • Ride the bubble • Generate high returns • Get out just before the bubble bursts
Rational Bubbles • Rational Arbitrageurs • Varying views/information about the bubble and when it will burst • Lack of synchronisation • Bubble bursts due to selling pressure when a sufficient amount of investors sell their positions • Therefore, the more dispersed the opinions of rational arbitrageurs, the longer it takes for mass “sell out” to occur
Rational Bubbles • Favour Behavioural view over EMH • Rational Arbitrageurs • Acknowledge the mispricing and fuel it further only to sell just before the bubble bursts • Optimal strategy for them, provided they get out at the right time • Whereas EMH assumes that mispricing will immediately be arbitraged away.
The EMH – “A Half Truth?” • Shiller (2002) • Semi-Strong form of EMH most widely accepted • Current security prices fully reflect allpublicinformation • Active portfolio strategy based on fundamental analysis is useless • Therefore, passive strategy (indexing) would be the superior option for the investor • Less transaction costs and time
The EMH Paradox • If all investors believed that the market was efficient and active strategies were useless • No investors doing fundamental analysis • Nobody making sure that securities are correctly priced • “Arbitrageurs” defined by the EMH that would correct any mispricing would not be looking for those mispricing
EMH Fuelling Bubbles? • For every analyst warning about overvaluation and the possibility of a bubble • There is the EMH and its supporters saying that the market could not be far out of line • Calverley(2009) • Used example of the 1990’s stock bubble • EMH supporters claimed that the market was always “correct” • Helped to reduce the sense of risk among investors
Are Markets Efficient? • The existence of bubbles and the associated irrationality decrease credibility of the EMH • Malkiel (2005) • Reckless to disregard the EMH all together • Supports market efficiency by using evidence from the past performance of active and passive investment strategies • market index, on average, consistently outperforms actively managed funds • i.e. markets are efficient in reacting to information
Summing up on the EMH • Shiller (2003) • Emphasises the importance of distancing ourselves from the ideas that: • markets always work perfectly • price changes always accurately reflect the relevant information. • Short-term deviations from Market Efficiency • Irrationality and inefficiency overcome the ideals of the EMH • Psychological and behavioural factors play a part in investment decisions • Eventually the bubble will pop
Quantifiable Explanations of Speculative Bubbles, Manias and Crashes
Economically Tangible Explanations • Literature focused on: • Great Crash of 1929 • Dot.Com bubble of 2000 • Explanations centred around: • Increased lending (prior to and during bubble) • Short-sales constraints (during bubble)
Increased Lending • White (1990) – Great Crash of 1929 • Contribution of brokers loans • Index of NYSE brokers’ loans tracked stock market index almost identically during bull market • Stock price movement and lending activity possibly almost perfectly positively correlated
Increased Lending • Allen and Gale (2000) • Risk shifting: investors borrow funds to invest • Downside risk shifting • Borrowers do not bear full loss of low returns • Bankruptcy and transfer of loss to bank • Upside risk shifting • Borrower pays bank and retains surplus • Investors likely to revise price levels upwards to earn (and maximise) this surplus
Short-Sales Constraints • Ofek and Richardson (2003) – Dot.Com Bubble • Pessimistic investors identify overvalued stocks • Directly sell stock after IPO lock-up period • Short-sell in the secondary market • Their selling activities revise prices downwards • Provide demand-supply balance, accurate market-pricing • Optimistic investors push prices upwards • In the absence of pessimistic investors
Short-Sales Constraints • Ofek and Richardson (2003) – Dot.Com Bubble • Secondary market • Find high short-selling interest • Low supply of short-selling opportunities • Primary market • Negative excess returns after lock-up period expiry • Largely attributed to pessimistic investor (short-selling) activity