Download
1 / 41
410 likes | 614 Vues
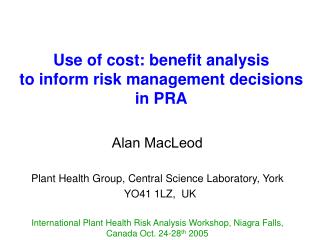
Use of cost: benefit analysis to inform risk management decisions in PRA. Alan MacLeod Plant Health Group, Central Science Laboratory, York YO41 1LZ, UK International Plant Health Risk Analysis Workshop, Niagra Falls, Canada Oct. 24-28 th 2005. Outline of presentation.

E N D
Use of cost: benefit analysis to inform risk management decisions in PRA Alan MacLeod Plant Health Group, Central Science Laboratory, York YO41 1LZ, UK International Plant Health Risk Analysis Workshop, Niagra Falls, Canada Oct. 24-28th 2005
Outline of presentation • Costs and benefits in SPS and the IPPC • Two examples • Thrips palmi • Diabrotica virgifera virgifera • Strengths and weaknesses • Key challenges
SPS Agreement (Art. 5 Assessment of risk) • In assessing the risk to plant health, Members shall take into account economic factors: • potential loss of production or loss of sales resulting from the entry, establishment or spread of a pest or disease; • the costs of control or eradication • SPS agreement does not mention benefits • cost-effectiveness of approaches to limit risks
IPPC ISPM 11 (PRA) • Stage 3: Pest risk management • Point 3.4 • Those measures with an acceptable benefit-to-cost ratio should be considered • measures chosen due to effectiveness of reducing probability of introduction (entry and establishment)
Example 1: Thrips palmi • EU Quarantine pest • Wide range of commercial hosts • Aubergines (egg plant) • Cucumbers • Sweet peppers • many ornamentals • Vector of plant viruses • Melon spotted wilt virus • Watermelon silver mottle virus
Example 1: Thrips palmi • Pest risk assessment shows could establish in glasshouses in northern Europe • Previous outbreak in NL glasshouses
Thrips palmi – 1st UK outbreak • Chrysanthemum glasshouse • Although not damaging to crop many other glasshouses nearby with cucumbers, aubergines and peppers • Measures aimed to eradicate to prevent establishment • What were the extra costs to the grower?
Estimated expenditure on invertebrate pest management in one glasshouse at Thrips palmi outbreak site over one year (Nov. 1999 to Oct. 2000)
Estimated expenditure on invertebrate pest management in one glasshouse at Thrips palmi outbreak site over one year (Nov. 1999 to Oct. 2000) Thrips palmi diagnosed late April 2000
Estimated cumulative expenditure on invertebrate pest management in one glasshouse at Thrips palmi outbreak site over one year (Nov. 1999 to Oct. 2000) Thrips palmi diagnosed late April 2000
Changes to producers profits (partial budgeting) • Sales were unaffected • Extra production costs • Pesticide spray costs • Soil fumigation (methyl bromide) • Treated compost • Plastic sheeting - additional labour • Costs up by approx. £15,000 (US$ 25,000) • Margin fell by between 13 and 18%
Cost: benefit analysisCosts = costs of eradication • Industry costs • determined from additional costs at outbreak site • Govenment costs • staff costs during campaign
What are the benefits ? • Losses avoided • Estimated by modelling
Modelling spread from the outbreak site • Use Monte Carlo technique to simulate uncontrolled spread from outbreak site • Consider two rates • Fast - similar to previous spread of Frankliniella occidentalis • nationwide in 3 years • Slow - based on T. palmi in Japan, • 10 years to occupy 2/3rds of the endangered area
Crops at risk from Thrips palmi US$ 107,000 US$ 8,500 Mean annual data, 2000-2001, Defra stats
Modelling impacts during spread • 10 years of uncontrolled spread • Susceptible crops incur losses • High impact (as in previous table) • Low impact (1/10th of previous) • Discount value of losses to present day
Cost: benefit ratios (eradication: losses avoided) • With fast spread, T. palmi reaches all susceptible glasshouse crops in 3 years (as with WFT). • With slow spread 2/3rds of glasshouses infested after 10 years.
Example 2: Implementation of EU measures against Diabrotica virgifera virgifera in the UK • First reported in Europe near Belgrade airport 1992 • Spreading across Europe • Damaging in permanent maize • Listed quarantine pest
Area suitable for establishment • Single generation requires 670 DD above 11°C • Climate is critical Cool (1996) Typical (1997) Hot (1995) Red, pink and purple cells show where Dvv can establish
Fig. A3(viii) Area suitable for establishment: sufficient temperature and maize (1996, cool)
Area suitable for establishment: sufficient temperature and maize (1997, typical) Fig. A3(ix)
Model details (1 -3) With EC control measures • 3 Spread scenarios • 0 km year-1 (costs of surveys only) • 0 to 1.5 km year-1 • 0 to 4 km year-1 • Monte Carlo simulation (10,000 iterations) • Area suitable for establishment (<100 - 120k ha) • Insecticide sprays = £46 ha-1(US$ 78 ha-1) • No maize in field for 2 years • 80% of area rotated at no extra cost • Costs from rotation (£182 ha-1 to £243 ha-1) • Costs from rotation (US$ 300 ha-1 to US$410 ha-1)
Model details (4 -6) Without EC control measures • 3 rates of spread • 0 to 15 km year-1 • 5 to 25 km year-1 • 10 to 40 km year-1 • Monte Carlo simulation (10,000 iterations) • Area suitable for establishment (<100 - 120k ha) • 20% not rotated • Impacts after 5 years • Maize worth £375 to £450 ha-1 (US$ 630 to US$ 760) • Yield losses 2 to 5% (6.5% in NE USA) • Model looks ahead 10 years
Costs of measures • Govt. costs (surveys, implementing measures) - based on staff costs on Dvv to date • Industry costs (treatments on infested fields, forced rotation) US $ (‘000) 5,900 11,100 – 12,500 21,500 – 26,300
Yield losses that are avoided US $ (‘000) 820 – 980 2,400-2,900 3,750 – 4,500
Conclusions • In UK no economic justification for EC measures • However consider assumptions • Faster spread • Greater yield losses • Climate change
Strengths & weaknesses of cost: benefit analysis • Uses a single metric ($, £, €) • Is easy to understand • Easy to communicate • Takes account of many aspects • However, lack of data means assumptions are necessary • Difficulty in assessing non-market goods • In simplifying results to a ratio, details are lost
Challenges • PRA workers often reacting to events • interceptions, incursions, little information • Key in assessing risk is identifying uncertainty • Research may reduce uncertainty (time constraints) • Probabalistic risk assessment may quantify uncertainty • Key to risk management is managing the uncertainty