Download
1 / 46
660 likes | 1.06k Vues
1.4 Assessment of yield losses imposed by plant pathogens. Introduction and definitions Effects of plant pathogens on host physiology Effects of plant pathogens on yield and its components Models for loss assessment Concluding remarks.

E N D
1.4 Assessment of yield losses imposed by plant pathogens • Introduction and definitions • Effects of plant pathogens on host physiology • Effects of plant pathogens on yield and its components • Models for loss assessment • Concluding remarks
Why do we need (want) to assess yield loss?orWhat are the uses of yield loss records Loss prediction Yield Time Disease intensity Time • For making decision concerning the need of disease management (cost/effective calculations). • For identifying the time when control is needed and assisting to develope effective management procedures.
Why do we need (want) to assess yield loss?orWhat are the uses of yield loss records Loss assessment Yield Time Disease intensity Time • For administrative decisions: making priorities in research, breeding, allocation of efforts, etc. • For insurance purposes.
Loss assessments can be made on several scales: • Individual plants • Small plots (e.g., experimental plots) • Individual field • Regions • Nations • The entire world
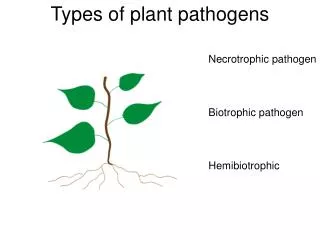
Effects on host physiology Effects on host development Leaf infection Effects on yield quality Effects on yield quantity How plant pathogens affect their hosts ?
How plant pathogens affect their hosts ? Effects on host physiology Stem infection Effects on host development Effects on yield quality Effects on yield quantity
Fruit rot Effects of plant pathogens on their hosts Effects on host physiology Effects on host development Effects on yield quality Effects on yield quantity
Fruit ghost spots How plant pathogens affect their hosts ? Effects on host physiology Effects on host development Effects on yield quality Effects on yield quantity
Effects of plant pathogens on host physiology • Effects of radiation interception (RI) • Effects of radiation use efficiency (RIE) reflected radiation intercepted radiation transmitted radiation
Seedling diseases Effects of plant pathogens on host physiology Effects of radiation interception Stand reducers
Alternaria macrospora in cotton Effects of plant pathogens on host physiology Effects of radiation interception Tissue consumers
Alternaria solani in tomatoes Effects of plant pathogens on host physiology Effects of radiation interception Leaf senescence accelerators
Smutty mold (Aspergillus sp.) in cotton Effects of plant pathogens on host physiology Effects of radiation interception Light “stealers”
100 Necrotic area infected area 50 Photosynthesis rate (%) 0 0 50 100 Disease severity (%) invaded area Effects of plant pathogens on host physiology Effects of radiation use efficiency photosynthetic rate reducers
Alternaria stomata stomata Effects of plant pathogens on host physiology Effects of radiation use efficiency Turgor reducers 100 50 Transpiration rate (%) 0 0 50 100 Disease severity (%)
stomata Effects of radiation use efficiency Turgor reducers 100 50 Transpiration rate (%) Powdery mildew 0 0 50 100 Disease severity (%)
rust pustules stomata Effects of radiation use efficiency Turgor reducers rusts 100 Transpiration rate (%) 50 0 0 50 100 Disease severity (%)
Effects of radiation use efficiency assimilate suppers Powdery mildews
Treatment yield (t/ha) yield increment t/ha % 4.265.03 -0.78 -15.4 UntreatedManeb Tebuconazole 5.70 1.44 25.2 Effects of Alternaria macrospora on cotton yield(mean of 11 field experiments)
15.0 Potential yield Attainable yield 8.0 -50% 6.0 Healthy-plot yield 5.0 Untreated-plot yield 3.0 +100% Measurement of yield loss: which reference to use? Commercially managed-plot yield -40% +66% (t/ha)
Measurement of yield loss: what is the reference? Differences between yield of a reference plot and yield of a diseased plot Loss = [yield of reference plot] - [yield of diseased plot] Reference plots: A non-infected (healthy) plot The least infected plot in the experiment Average yield of commercial plot in the area
Yield (t/ha) 0 100 Disease severity (%) Measurement of yield loss: what is the reference? Differences between estimated yield of a healthy plot and yield of a diseased plot Loss = [estimated yield of healthy plot] - [yield of diseased plot]
Yield (t/ha) Yield loss (%) Disease intensity ( %) Disease intensity ( %) The damage function The quantitative relationship between disease intensity and yield (or yield loss)
Linear Logarithmic Yield Yield Disease intensity Disease intensity Compensation Optimum Yield Yield Disease intensity Disease intensity The damage function
The relationship between the time of disease development and the resultant yield loss
Grain filling Boot stage Tillering Emergence Yield components of cereals
no. of plants per unit area no. of ears per plant no. of ears per unit area no. of spikelets per ear no. of spikelets per unit area no. of grains per spikelet no. of grains per unit area weight of a grain Yield per unit area Yield components of cereals
Effects of powdery mildew in barley on yield and its components untreated % difference No. of ears/plant No. spikelets/ear Grain wt. Yield 19.1* 7.6 4.2 28.5* Disease severity (%) sprayed emergence tillering Growth stage The yield components that are affected by plant diseases are those that are created at, or soon after, the time of disease onset
untreated % difference No. of ears/plant No. spikelets/ear No. grains/spikelet Grain weight Yield 2.5 0.8 8.1* 8.0* 18.1* sprayed Effects of Septoria tritici blotch in wheat on yield and its components Disease severity (%) tillering milk earing Growth stage
In Israel, Septoria tritici blotch in wheat affects only the weight of individual grains. Thus, there is no need to control the disease before the earing stage. Similarly, the is no need to control the disease after most of the grain weight was accumulated.
Yield production Reproductive growth Vegetative growth Emergence Yield components of a board-leaf plant
no. of plants per unit area no. of fruits per plant no. of fruits per unit area weight of individual fruit Yield per unit area Yield components of a broad-leaf plant
Boll weight Boll Number untreated Yield sprayed Effects of Alternaria in cotton on yield and its components
A. macrospora affect only the number of bolls per plant. Bolls are shed only at the initial stages of their development. Thus, disease management is very important early in the season when the bolls are small, but not towards the end of the season, when the bolls had already developed enough.
disease assessment harvest Disease severity (%) Yield (t/ha) G1 Time Disease severity at time G1 (%) Y = 0- 1X Y = yield of a diseased plot 0 = estimated yield of a healthy plot1 = reduction in yield for each percent increase in disease severity X = disease severity of the diseased plot The critical point model
Uses of critical point models The critical point model is used mainly in cereals. In cereals have distinct growth stages and it is possible to determine precisely which crop growth stage is affected most by the disease. This stage should be chosen to be the “critical” stage - for assessment. Critical point models are used mainly for “after-season” loss assessment.
disease assessments harvest Disease severity (%) T1 T2 T3 T4 T5 T6 T7 T8 Y = 0- 1X1 - 2X2 - 3X3 - 4X4 - 5X5 - 6X6 - 7X7 - 8X8 Time Y = yield of a diseased plot 0 = estimated yield of a healthy plot1-8 = reduction in yield in each sampling for each percent increase in disease severity X1-X8 = disease severity of the diseased plot in each date The multiple point model
Uses of multiple point models The multiple point model is used mainly in broad-leaf crops. In broad-leaf crops yield is accumulated during a long period and there are no distinct growth stages. In many cases, the disease affect yield during the whole period of its accumulation. Multiple point models are used mainly for “after-season” loss assessment.
Critical severity Disease severity (%) Yield (t/ha) T1 T2 T3 T4 Time Time for critical severity (days) Y = 0+ 1X Y = yield of a diseased plot 0 = estimated yield of a plot infected at day 01 =increase in yield for each day of delay in time to critical severity X = time for critical severity in diseased plot The critical time model
Uses of critical time models Critical time models may be used in both cereals and broad-leaf crops. These models are applicable in situations where disease onset vary markedly from year to year and from location to location. The critical time models may be used for decision making. For that purpose, the critical severity level to be used should be low enough, to enable proper disease suppression.
Disease severity (%) Time Y = 0- 1X Yield (t/ha) Y = yield of a diseased plot 0 = estimated yield of a healthy plot1 =decrease in yield for each increase in AUDPC unit X = AUDPC units AUDPC (Disease*days) The Area Under the Disease Progress Curve (AUDPC) model
Uses of the AUDPC models The AUDPC models are used in both broad-leaf and cereal crops. In most cases, a very good relationship exist between AUDPC values and yield. The AUDPC models are used mainly for “after-season” loss assessment.
Concluding remarks • Losses may be predicted early in the season for management decision making or after the season for general analyses. • Plant pathogens may affect the physiology of the host and result in yield losses directly or indirectly. • Determination of the yield component to be affected by the disease is an important component of an IPM strategy. • Yield loss should be determined in relation to a reference plot. • Yield loss may be quantified by several models: the critical point model, the multiple point model, the critical time model and the AUDPC model.