Download
1 / 4
40 likes | 96 Vues
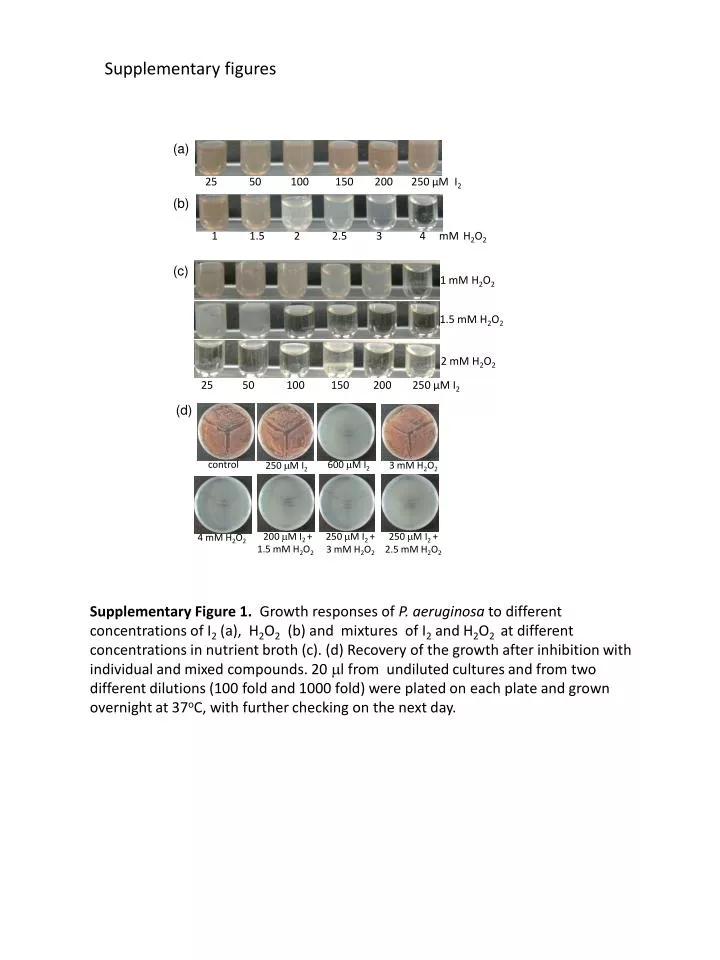
Supplementary figures. 25 50 100 150 200 250 µM I 2. (a). H 2 O 2. 1 1.5 2 2.5 3 4 mM. (b). 1 mM H 2 O 2. 1.5 mM H 2 O 2. (c). 2 mM H 2 O 2.

E N D
Supplementary figures 2550 100 150 200 250 µM I2 (a) H2O2 1 1.5 2 2.5 3 4 mM (b) 1 mM H2O2 1.5 mM H2O2 (c) 2 mM H2O2 25 50 100 150 200 250 µM I2 (d) Supplementary Figure 1. Growth responses of P. aeruginosa to different concentrations of I2 (a), H2O2 (b) and mixtures of I2 and H2O2 at different concentrations in nutrient broth (c). (d) Recovery of the growth after inhibition with individual and mixed compounds. 20 l from undiluted cultures and from two different dilutions (100 fold and 1000 fold) were plated on each plate and grown overnight at 37oC, with further checking on the next day. 4 mMH2O2 600 M I2 3 mM H2O2 250 M I2 control 200 M I2+ 1.5 mMH2O2 250 M I2+ 2.5 mMH2O2 250 M I2+ 3 mMH2O2
(a) 0 100 150 200 250 300 µM I2 50 75 100 150 200 250 µM H2O2 (c) (b) 75 µM H2O2 100 µM H2O2 150 µM H2O2 0 100 150 200 250 300 µM I2 (d) 250 M I2 control 400 M I2 250M H2O2 150M H2O2 Supplementary Figure 2. Growth responses (growth or no growth) of S. aureus to different concentrations of I2 (a), H2O2 (b) and mixtures of I2 and H2O2 at different concentrations in nutrient broth (c). (d) Recovery of the growth after inhibition with individual and mixed compounds. 20 l from undiluted cultures and from two different dilutions (100 fold and 1000 fold) were plated on each plate and grown overnight at 37oC, with further checking on the next day. 100 M I2 + 150M H2O2 300 M I2+ 150M H2O2 250 M I2+ 75M H2O2
control 250 M I2 2mM H2O2 200 M I2 4mM H2O2 100 M I2+2.5mM H2O2 200 M I2 + 2mM H2O2 250 M I2 + 3mM H2O2 (a) (a) 0 1 1.5 2 2.5 3 mM H2O2 (b) 50 75 100 150 200 250 µM I2 100µM I2 (b) 150µM I2 (c) c) 200µM I2 250µM I2 1 1.5 2 2.5 3 mM H2O2 (d) Supplementary Figure 3. Growth responses (growth or no growth) of S. cerevisiae to different concentrations of H2O2 (a), I2 (b) and mixtures of I2 and H2O2 at different concentrations in YEPD liquid medium (c). (d) Recovery of the growth after inhibition with individual and mixed compounds. Before plating cultures were diluted 1000 times and 100 times. In cases of mixed compounds, both diluted and undiluted cultures were plated. The plated were incubated for 2 days at 30oC.
400 M I2 + 600 M H2O2 400 M I2 + 100 M H2O2 600 M I2 600 M H2O2 100 M I2 50 100 200 300 400 µM I2 (a) 100 200 400 600 800 µM H2O2 (b) 50 µM I2 100 µM I2 (c) 200 µM I2 300 µM I2 100 200 400 600 800 µM H2O2 (d) Supplementary Figure 4. Growth responses (growth or no growth) of E. coli to different concentrations of I2 (a), H2O2 (b) and mixtures of I2 and H2O2 at different concentrations in nutrient broth (c). (d) Recovery of the growth after inhibition with individual and mixed compounds. 20 l from undiluted cultures and from two different dilutions (100 fold and 1000 fold) were plated on each plate and grown overnight at 37oC, with further checking on the next day.