Data Processing and Harmonisation Techniques for Transboundary Aquifers
This document outlines the methodology and practices for data processing and harmonisation in the context of transboundary aquifers, particularly focusing on the experiences from Uzbekistan and Kazakhstan. It emphasizes the importance of standardised formats, including digital maps, tables, and paper reports, to transform raw data into structured formats. The discussion includes agreements on units and classifications, ensuring consistency across different regions. The produced outputs comprise thematic maps, indicators, and comprehensive assessment reports that aid in effective water management and planning.

Data Processing and Harmonisation Techniques for Transboundary Aquifers
E N D
Presentation Transcript
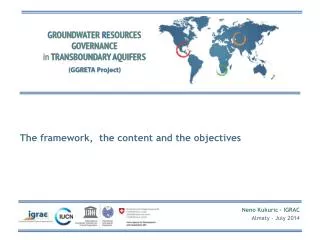
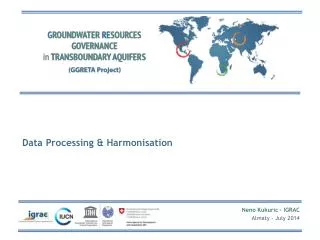
Data Processing & Harmonisation Neno Kukuric- IGRAC Almaty - July 2014
Data Processing • Structured data • Standardisedformats: • Digital maps • Tables (excel) • Text • Data collection • Paper maps • Paper reports • Text, tabular data, images, maps • Digital data • Tables, maps, reports From ‘raw’ data to consistently structured data
From ‘technical’ maps to simplified thematic maps Data Processing
Harmonisation: Formations Uzbekistan Kazakhstan ?
Harmonisation: map information Transboundary aquifer For example information on Aquifer productivity (Namibia) and Groundwater potential (Botswana)
Harmonisation: agreements on units Borehole yield • m3/hr (Namibia), l/s (South Africa)
Data processing & Harmonisation • Harmonisation is about developing a common language and terminology, i.e. agreeing on: • classifications (suitability for water consumption, land use types, water use types, stratigraphy, etc. etc.) • map scale and map projection • areal sub-divisions for reporting (eg report per local municipality or per district?) • units • table formats • report format • additions/modifications to the methodology (eg: Groundwater community management) • …. • ….
Project workflow / tasks Data collection (incl. data entry and digitising of relevant information) Taking stock(which data are available and which not) and fine-tuning of methodology (data & indicators) Structuring of data (data processing) Harmonisingdatain a consistent way across the aquifer Producing outputs: Indicators, thematic maps, overview tables, illustrative graphs, conceptual model, assessment report