Voronoi Diagrams
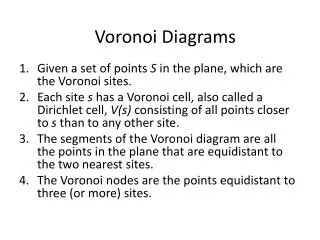
Voronoi Diagrams. Voronoi Diagram. Input: A set of points locations ( sites ) in the plane. Output: A planar subdivision into cells. Each cell contains all the points for which a certain site is the closest. Application: Nearest-neighbor queries (by point location in the diagram).


Voronoi Diagrams
E N D
Presentation Transcript
Voronoi Diagram • Input: A set of points locations (sites) in the plane. • Output: A planar subdivision into cells. Each cell contains all the points for which a certain site is the closest. • Application: Nearest-neighbor queries (by point location in the diagram). The bisector between two points is a line.
Voronoi Diagram • Assume no four sites are co-circular. • The Voronoi diagram is a planar graph, whose vertices are equidistant from three sites, and edges equidistant from two sites. • The convex hull of the sites are those who have an unbounded cell. 7
Voronoi Diagram – Naïve Construction • Construct a bisector between one site and all others. • A Voronoi cell is the intersection of all half-planes defined by the bisectors. • Time complexity: O(nlogn) for each cell. Total time O(n2logn) • Corollary: Each cell in a Voronoi diagram is a convex polygon, possibly unbounded.
Voronoi Diagram • If all the sites are colinear, the Voronoi diagram will look like this: • Otherwise, the diagram is a connected planar graph, in which all the edges are line segments or rays
Voronoi Diagram Complexity • A Voronoi diagram of n distinct sites contains n cells. • One cell can have complexity n-1, but not all the cells can. • The number of vertices V 2n-5 • The number of edges E 3n-6 • The number of faces F = n
Voronoi Diagram Properties • A vertex of a Voronoi diagram is the center of a circle passing through three sites. • Each point on an edge is the center of a circle passing through two sites.
Computing Voronoi Diagrams • Plane sweep. • The difficulty: If we maintain the VD of all points seen in the sweep so far – this can change as new points are swept.
Beach line breakpoint The Beach Line • The bisector between a point and a line is a parabola. The beachline is the lower envelope of all the parabolas already seen. • Sweep the plane from above, while maintaining the invariant: the Voronoi diagram is correct up to the beach line. • The beach line is an x-monotone curve consisting of parabolic arcs. The breakpoints of the beach line lie on the Voronoi edges of the final diagram.
The Algorithm • Possible events: • Site event – The sweep line meets a site. A vertical edge (skinny parabola) connects the point and the arc above it. These events are predetermined • Vertex event – An existing arc of the beach line shrinks to a point and disappears, creating a Voronoi vertex. Generated by consecutive triples of sites.
P3 P1 P2 P1P3 P1P2 P1P3 P1 P2 P1 P3 Beach Line Data Structure • A binary tree of sites: • A leaf contains a site representing a parabolic arc. • A site may appear in more than one leaf. • Interior nodes describe immediate neighborhood relations. • The tree must support insertion and deletion.
Complexity of the Beach Line • The complexity of the beach line is O(n). • The first site generates one parabola. • Each other site can transform one parabola into three. • Total: 1+(3-1)(n-1) = 2n-1 P1 P2 P1 P1, P2, P1 Beach line
The Event Queue • Contains two types of information: • For a site event – site ID. • For a vertex event – lowest point of the circle and IDs of the triple of sites. • Event priority: Its y coordinate. • Events are added and deleted.
Creating a Vertex Event • Each time a new arc is created in the beach line, check for a possible vertex event among new consecutive triples of arcs. • The circle must: • Intersect the sweep line. • Contain no other points lying above the sweep line. • Note: Some events may be false alarms (the circle contains points below the sweep line), which will be deleted later during a site event. Vertex event False Alarm
Handling Events • Site event • Split arc vertically above site. • Delete old triples from tree. • Add new triples to tree. • Delete vertex events whose three generators have been eliminated. • Vertex event • Create Voronoi vertex. • Delete appropriate arc. • Delete old triples from tree. • Add new triples to tree.
Complexity Analysis • Initialization – O(nlogn). • Number of events: O(n). Each event requires O(log n) time. • Note: A constant number of false alarm vertex events are created and deleted only when another real event occurs (so their number is also O(n)). • Total time: O(nlogn). • Space: The beach line structure and the Voronoi diagram both consume linear space – O(n).
Constructing Voronoi diagram using Divide-and-Conquer • Divide the points into two parts.
Merging two Voronoi diagrams • Merging along the piecewise linear hyperplane
The final Voronoi diagram • After merging
Divide-and-conquer for Voronoi diagram • Input: A set S of n planar points. • Output: The Voronoi diagram of S. Step 1: If S contains only one point, return. Step 2: Find a median line L perpendicular to the X-axis which divides S into SL and SR such that SL (SR) lies to the left(right) of L and the sizes of SL and SR are equal.
Step 3: Construct Voronoi diagrams of SL and SR recursively. Denote these Voronoi diagrams by VD(SL) and VD(SR). Step 4: Construct a dividing piece-wise linear hyperplane HP which is the locus of points simultaneously closest to a point in SL and a point in SR. Discard all segments of VD(SL) which lie to the right of HP and all segments of VD(SR) that lie to the left of HP. The resulting graph is the Voronoi diagram of S. (See details on the next page.)
Mergeing Two Voronoi Diagrams into One Voronoi Diagram • Input: (a) SL and SR where SL and SR are divided by a perpendicular line L. (b) VD(SL ) and VD(SR ). • Output: VD(S) where S = SL ∩SR Step 1: Find the convex hulls of SL and SR, denoted as Hull(SL) and Hull(SR), respectively. (A special algorithm for finding a convex hull in this case will by given later.)
Step 2: Find segments and which join HULL(SL ) and HULL(SR ) into a convex hull (Pa and Pc belong to SL and Pb and Pd belong to SR) Assume that lies above . Let x = a, y = b, SG= and HP = . Step 3: Find the perpendicular bisector of SG. Denote it by BS. Let HP = HP∪{BS}. If SG = , go to Step 5; otherwise, go to Step 4.
Step 4: The ray from VD(SL ) and VD(SR) which BS first intersects with must be a perpendicular bisector of either or for some z. If this ray is the perpendicular bisector of , then let SG = ; otherwise, let SG = . Go to Step 3. Step 5: Discard the edges of VD(SL) which extend to the right of HP and discard the edges of VD(SR) which extend to the left of HP. The resulting graph is the Voronoi diagram of S = SL∪SR.
Time Complexity • Merging takes O(n)time (This is the Key!) • T(n)=2 * T(n/2)+O(n) • T(n)= O(n log n) • Veure: http://www.personal.kent.edu/~rmuhamma/Compgeometry/MyCG/Voronoi/DivConqVor/divConqVor.htm