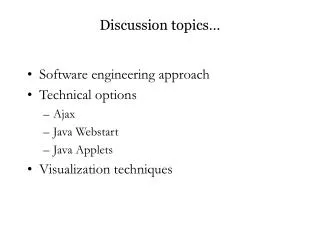
Discussion topics…
Discussion topics…. Software engineering approach Technical options Ajax Java Webstart Java Applets Visualization techniques. Software Engineering. Requirements Need a unifying data model Commonalities of workflow should be identified Iterative approach

Discussion topics…
E N D
Presentation Transcript
Discussion topics… • Software engineering approach • Technical options • Ajax • Java Webstart • Java Applets • Visualization techniques
Software Engineering • Requirements • Need a unifying data model • Commonalities of workflow should be identified • Iterative approach • zfin and flybase are fantastic mechanisms for determining requirements and for taking an iterative approach
Technical options • Ajax • Java Webstart • Java Applets
What is visualization? • Understanding and seeing • We talk about trying to make our thoughts clear, to bring them into focus • “To visualize” – really means “to construct a visual image in the mind” – but now also refers to “a graphical representation of data or concepts” • Defn of Visualization: The use of computer-supported, visual representation of data to amplify cognition • The purpose of visualization is insight, not pictures • Visualizations can be said to be naturalor visually efficient
External Cognitive Aids • External cognition • Internal and external representation and processing weave together in thought • External cognitive aids can enhance cognition • Examples: • Slide rule • For multiplication, use of paper reduces the time required by a factor of 5 (for most people) – Why? • An important class of external cognitive aids that make us smart are graphical inventions • Charts for navigation • Diagrams
Using Vision to Think • A graphic picture may be used to communicate a preexisting idea or thought • But graphical aids can also be used in formulating ideas and thoughts (“Using Vision to Think”)
Reading a diagram • 3 levels of reading: • Read Fact • Read Comparison • Read Pattern
Active Diagrams • Amplifying the effect of a good visual representation by making it interactive • www.smartmoney.com (click on market maps) • Baby name viewer: http://babynamewizard.com/namevoyager/lnv0105.html
Other demos and various technologies • Visual Attribute Explorer – Java program: http://www.alphaworks.ibm.com/tech/visualexplorer • TableLens – Java applet: http://www.inxight.com/products/sdks/tl/(see demos on right) • Spacetree: http://www.cs.umd.edu/hcil/spacetree/ (Available as a downloadable app, Java Webstart, Java Applet) • See also Tamara Munzner’s work on the SequenceJuxtaposer http://olduvai.sourceforge.net/sj/, and the TreeJuxtaposer work at http://www.cs.ubc.ca/~tmm/papers/tj/ • Jambalaya available as a Java applet and Java client side (http://www.thechiselgroup.org/jambalaya )
Knowledge Crystallization (1) • Knowledge crystallization involves getting insight about data relative to some task • Steps required in a Knowledge Crystallization task: • Information foraging (from repositories, people…) • Search for/build a schema (representation) –need to know what to include/omit • Instantiate schema with data • Problem solve to trade-off features • May have to search for a new schema • Package the patterns found in some output product(i.e. a concise briefing of results)
Knowledge Crystallization (2) • A visualization tool has to support or automate some of these steps, it is a cognitive aid during our process of schematization • So we need a task, some data and a schema before we can instantiate a visualization
How Visualization Amplifies Cognition Different ways that visualizations could help amplify cognition: • By increasing memory and processing resources available • By reducing the amount of time to search • Enhancing the detections of patterns and enabling perceptual inference operations • Aid perceptual monitoring • By encoding information in a manipulable medium
Mapping Data to Visual Form • Different forms of data: • Data tables • Meta data (descriptive data about data) • Hierarchies, heterarchies
Types of data • Entities – objects of interest • Relationships • form structures that relate entities • many kinds of relationships • Attributes of entities or relationships • if they cannot be thought of independently • Operations (cf Colin Ware) • Operations (actions) can also be considered as data
Attribute quality (variable types) • Nominal data • Labeling function (e.g. apple, orange), category data that can be directed compared (=) • Ordinal data • Sequencing things, ranking (<,>) • Quantitative data • Real numbers (e.g. object A is twice as big as B, can do arithmetic on them, ratios) • And Interval data • Able to derive gap between data values (e.g. time of departure and arrival of an aircraft) We can sometimes transform one type of data into another
Interaction and Transformation Controls • Raw Data Data Table filtering • Data Table Visual Structure pick mappings • Visual Structure Views probes, viewpoints, distortions
Navigation and Ontologies • Can the users help to create their own locomotional structures over the information space? • Look at “paths worn” • Two ideas: • NavTracks • Mylar (Chris)
NavTracks – Motivation • Navigation in software development can be slow and tedious – often hard to find the right resource • Features like “content-assist” and dependency views partially help but navigation is often not “dependency based” • Singer noticed that developers tend to work on small clusters of files • Goal: develop a lightweight tool that recommends related files based on the current file • Approximate but efficient • Non-disruptive • Current
NavTracks – File Recommender • Lightweight navigation aid • Based on the current location and your historical navigation process • Heuristics such as temporal proximity, frequency of co-occurrence • Returns you to last known location within a file • Plan is to extend it to gather group navigation events • Initial results are encouraging
Mylar -- Degree of Interest Model • [Kersten/Murphy, UBC, see http://www.eclipse.org/mylar] • Shows you only what you are working on: • 1a. Aluminized film used to avoid blindness when staring at a solar eclipse • 1b. UI ‘skin’ used to avoid information blindness when staring at Eclipse • Presentation: • Filter/collapses uninteresting elements • Highlights/expands interesting elements • How it determines what to present: • Monitors editing and navigation • Encodes degree of interest, periodic decay (inspired by Card’s Tree Visualization work)
Supports a developer’s work practice • Context is explicit, can be saved and restored (use of landmarks) • Multiple tasks can be active • Tasks can be linked to bug reports • Active Search and Active Type Hierarchy updates related elements eagerly in the background • Interest based Content Assist • Performance improvements -- reduces memory footprint by limiting view population
Mylar and Protege Demo… (Chris)
Figure 5.2 PROMPTViz in histogram colouring mode, with the treemap sized so classes with the most number of changed descendents are drawn largest. The bars in the histograms, ordered from left to right, represent the percentage of descendents classified as unchanged, added, deleted, moved-from, moved-to and directly changed respectively.
Figure 5.3 The histogram colouring mode with the treemap sized by percentage of descendents that have any type of change
Figure 5.4 Reclassification of cell adhesion molecule shown by dotted arc. Note the subclasses of the old position of cell adhesion molecule are greyed (actually yellowed) out because they are no longer in this position.
Figure 2: 5 – PromptViz in solid colouring mode, with arc showing the reclassification of the concept ‘Gross_Anotomy_Concepts’. The node in the top right corner represents the old position of the class and an arc points to the new location.