Download
1 / 1
10 likes | 131 Vues
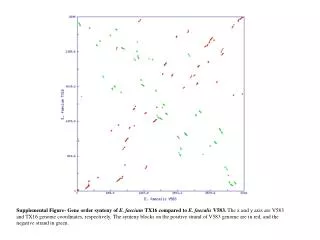
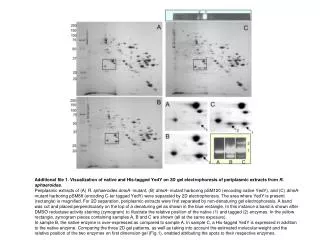
This figure illustrates the gene order synteny between the genomes of Enterococcus faecium TX16 and Enterococcus faecalis V583. The x-axis represents the genome coordinates of V583, while the y-axis denotes the coordinates of TX16. Synteny blocks are visually distinguished by color: red for the positive strand of the V583 genome and green for the negative strand. This visual comparison aids in understanding evolutionary relationships and genomic organization between these two Enterococcus strains.

E N D
Supplemental Figure- Gene order synteny of E. faecium TX16 compared to E. faecalis V583. The x and y axis are V583 and TX16 genome coordinates, respectively. The synteny blocks on the positive strand of V583 genome are in red, and the negative strand in green.


![[S1]](https://cdn2.slideserve.com/4310044/slide1-dt.jpg)